 findclout.com
Social Media Advertising Cost by Platform: 2026 Benchmarks
For 2026 planning, Meta sits around a $13.48 median CPM with $0.60–$0.70 US traffic CPC, TikTok near $9.16 CPM and $1.02 CPC, and creator-network placement starts at $0.20–$0.25 CPM. Those figures aren't interchangeable prices for American attention, because served impressions, clicks, and verified views measure different things.
The popular advice is to pick the platform with the cheapest CPM. That's a poor buying rule. A campaign that reaches the wrong countries or puts your logo beside unsuitable content can look efficient in a dashboard while wasting your budget.
The useful comparison is cost per verified US view on an approved placement, followed by the cost of the business outcome you need. Geography and brand safety belong in the calculation, not in the footnotes.
Table of Contents
- 2026 Social Media Advertising Costs by Platform
- Why CPM Is Not the Price You Actually Pay
- What Drives Social Media Advertising Costs Up and Down
- How Industry Demand Changes Budgeting
- Creator Networks and the Cost of a Verified US View
- Choosing Channels by Budget and Objective
- How to Set and Stress-Test Your Budget
2026 Social Media Advertising Costs by Platform
For US-focused planning, Meta and TikTok provide useful auction baselines, but neither platform sells a guaranteed campaign at its benchmark median. Treat X and Snapchat estimates even more cautiously because comparable public benchmark coverage is thinner.
2026 social media advertising cost benchmarks by platform
| Platform | 2026 CPM range | Typical CPC | Best suited for |
|---|---|---|---|
| Facebook / Instagram (Meta) | Approximately $13.48 median; ecommerce approximately $15.06 | $0.60–$0.70 for US traffic | Conversions, retargeting, broad US reach |
| TikTok | Approximately $9.16 median in-feed | Approximately $1.02 in-feed | Younger audiences and incremental reach |
| X | Illustrative planning assumption of $6–$10, not a verified benchmark | Illustrative assumption of $0.50–$2.00 | Live moments, tech, finance, news conversation |
| Snapchat | Illustrative planning assumption of $2–$4, not a verified benchmark | Illustrative assumption of $1–$3 | Testing younger-audience reach |
| Creator networks | Our placement ceilings are $0.20–$0.25; content campaigns are $1.50–$3.00 | Billed per verified view rather than click | Scaled US tier-1 reach, sports and culture moments |
The auction medians come from the Silverback 2026 Paid Media Benchmark Report, which reports Facebook/Instagram CPM of approximately $13.48, TikTok in-feed CPM of $9.16, and TikTok in-feed CPC of $1.02. Its combined Meta CTR is 2.19%, compared with 0.61% for TikTok.
The ecommerce and US traffic entries represent different campaign objectives, not alternative prices for the same purchase. Their measurement context matters more than their proximity in a table. X and Snapchat entries are hypothetical budgeting inputs to replace with account-level forecasts before committing spend.
Read the table by objective
Facebook and Instagram appear together because buyers manage both through Meta's advertising system. Placement-level performance still needs separate inspection. A blended account result can hide an expensive Instagram placement or a Facebook placement producing cheap but unqualified traffic.
TikTok offers cheaper benchmark impressions, but its lower benchmark click propensity means cheaper reach doesn't automatically produce cheaper visits. Creative has to earn the next action. A clip that gets watched without making the offer clear can satisfy an awareness objective and fail a sign-up objective.
For purchase campaigns, I would start with Meta and evaluate TikTok as an incremental channel. For American cultural reach, I would test creator distribution against both rather than assume auction inventory deserves the entire budget.
- Buying purchases: Compare contribution margin, acquisition cost, and returning-customer exclusions.
- Buying visits: Inspect landing-page engagement and completed sign-ups, not platform clicks alone.
- Buying attention: Require approved placements, geographic reporting, and a defined view standard.
Use our Facebook ads cost guide when separating Meta's campaign objectives and placement economics. Select the channels that fit the job, then establish a common measurement basis before accepting any quoted CPM.
Why CPM Is Not the Price You Actually Pay
Clicks can get cheaper while impressions get more expensive. Digital Applied's Meta benchmark analysis reports US traffic CPC falling from $0.70 to $0.60, while ecommerce Meta CPM increased 13.24% to $15.06; it also cites paid-social CPC declining 18% year over year in Q2 2026 while impression costs rose.
That isn't a contradiction. Different objectives, audiences, and creative produce different relationships between delivery and action. An auction prices an opportunity to display an ad, not a promise that an appropriate American customer will pay attention.
These measurement bases describe different purchases.
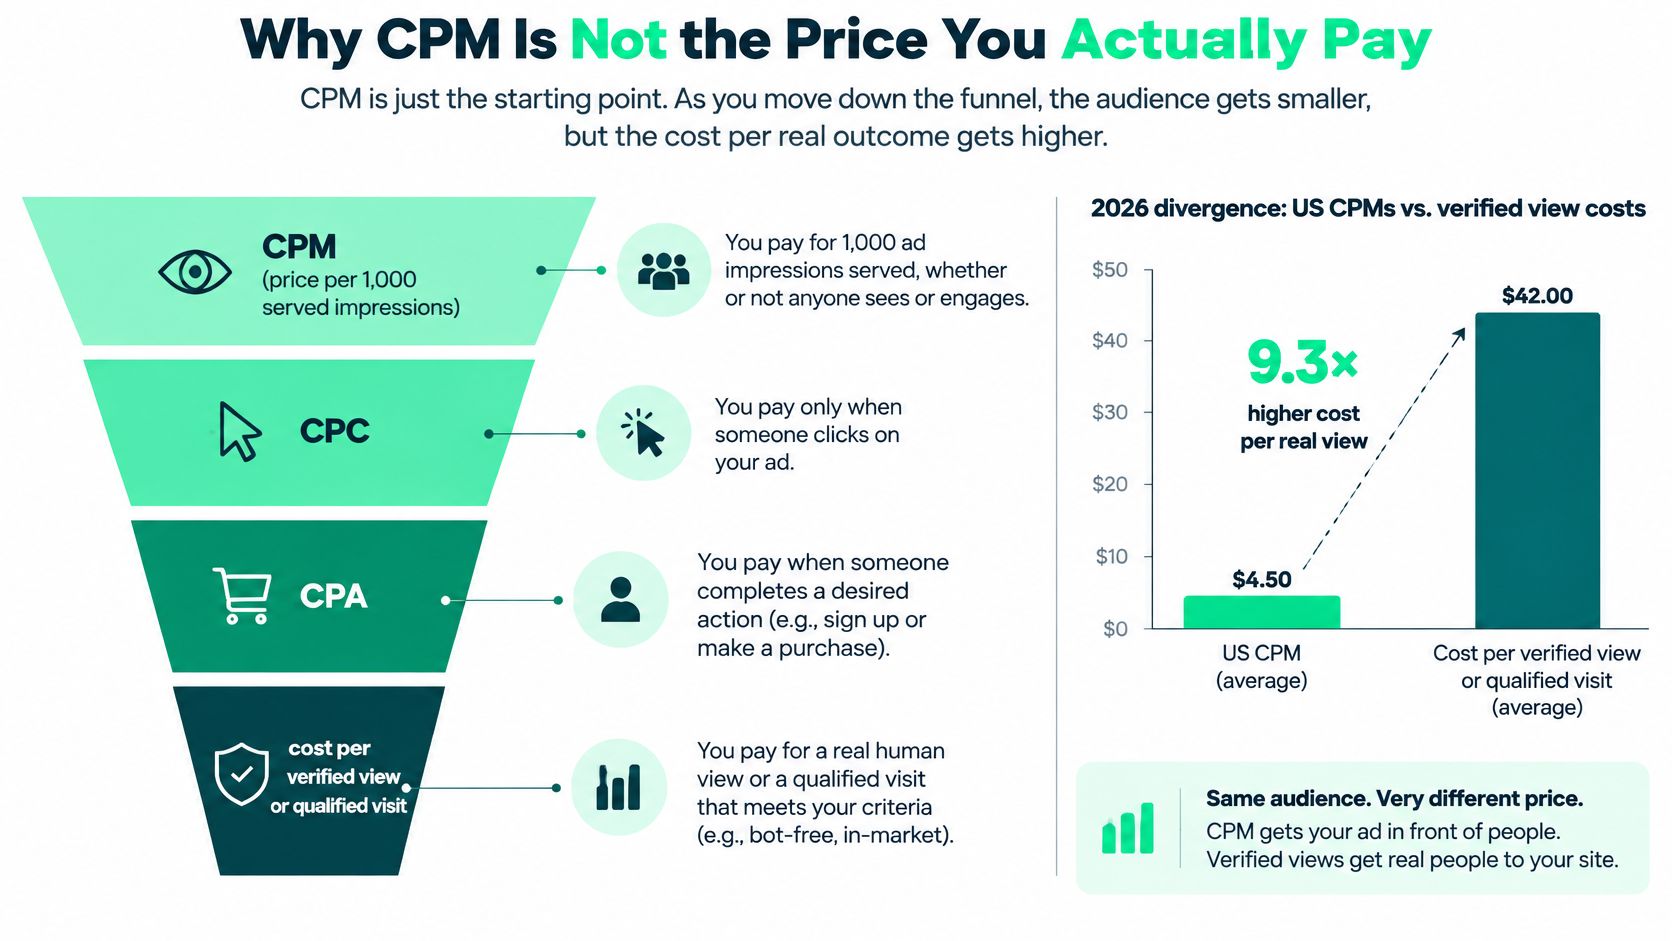
Define the denominator before comparing prices
CPM is spend per thousand served impressions. CPC divides spend by clicks, while CPA divides it by the acquisition event you've defined. Cost per verified view or qualified visit adds an acceptance standard to the denominator.
That standard needs to be explicit. A verified view isn't automatically a completed video view, a unique viewer, or a US viewer. Specify the geography, placement eligibility, fraud exclusions, and viewing requirement separately.
Our explanation of CPM advertising covers the basic calculation. For channel selection, use a stricter procedure:
- Fix the comparison conditions. Hold audience geography, flight dates, creative theme, and attribution window constant.
- Define eligible delivery. Identify approved handles or placements, acceptable countries, and invalid-traffic exclusions.
- Calculate verified-view CPM. Divide spend by eligible verified views, then multiply by a thousand.
- Connect attention to outcomes. Compare qualified visits, completed registrations, and incremental conversions.
Frequency needs its own column. Repeated views may help recall, but they aren't additional people. Don't let a large view count stand in for unique American reach.
An illustrative reconciliation
Say a hypothetical flight spends $10,000 at the Meta median quoted earlier and generates approximately 742,000 served impressions. Suppose only 500,000 qualify as verified US views on approved placements.
The effective verified-view CPM is $20.00, calculated as $10,000 divided by 500,000, multiplied by 1,000. These are illustrative campaign assumptions, not an observed performance result.
A cheap impression you cannot verify is not a price, it is a hope.
The gap doesn't prove the platform failed. It shows that the auction denominator and your buying denominator differ. Demand the measurement basis behind every benchmark, including whether production, distribution, verification, and repeated exposure are included.
What Drives Social Media Advertising Costs Up and Down
Your objective changes whom the platform tries to reach. A reach campaign seeks inexpensive exposure; a conversion campaign seeks people its system expects to act. Comparing their CPMs without comparing their jobs encourages the wrong optimization.
For a US-targeted buyer, the practical question isn't whether a reach campaign can beat a purchase campaign on impression cost. It's whether each campaign delivers its intended outcome without sacrificing geography or placement quality.
The chart illustrates the seasonal shape, not a quoted quarterly price series.
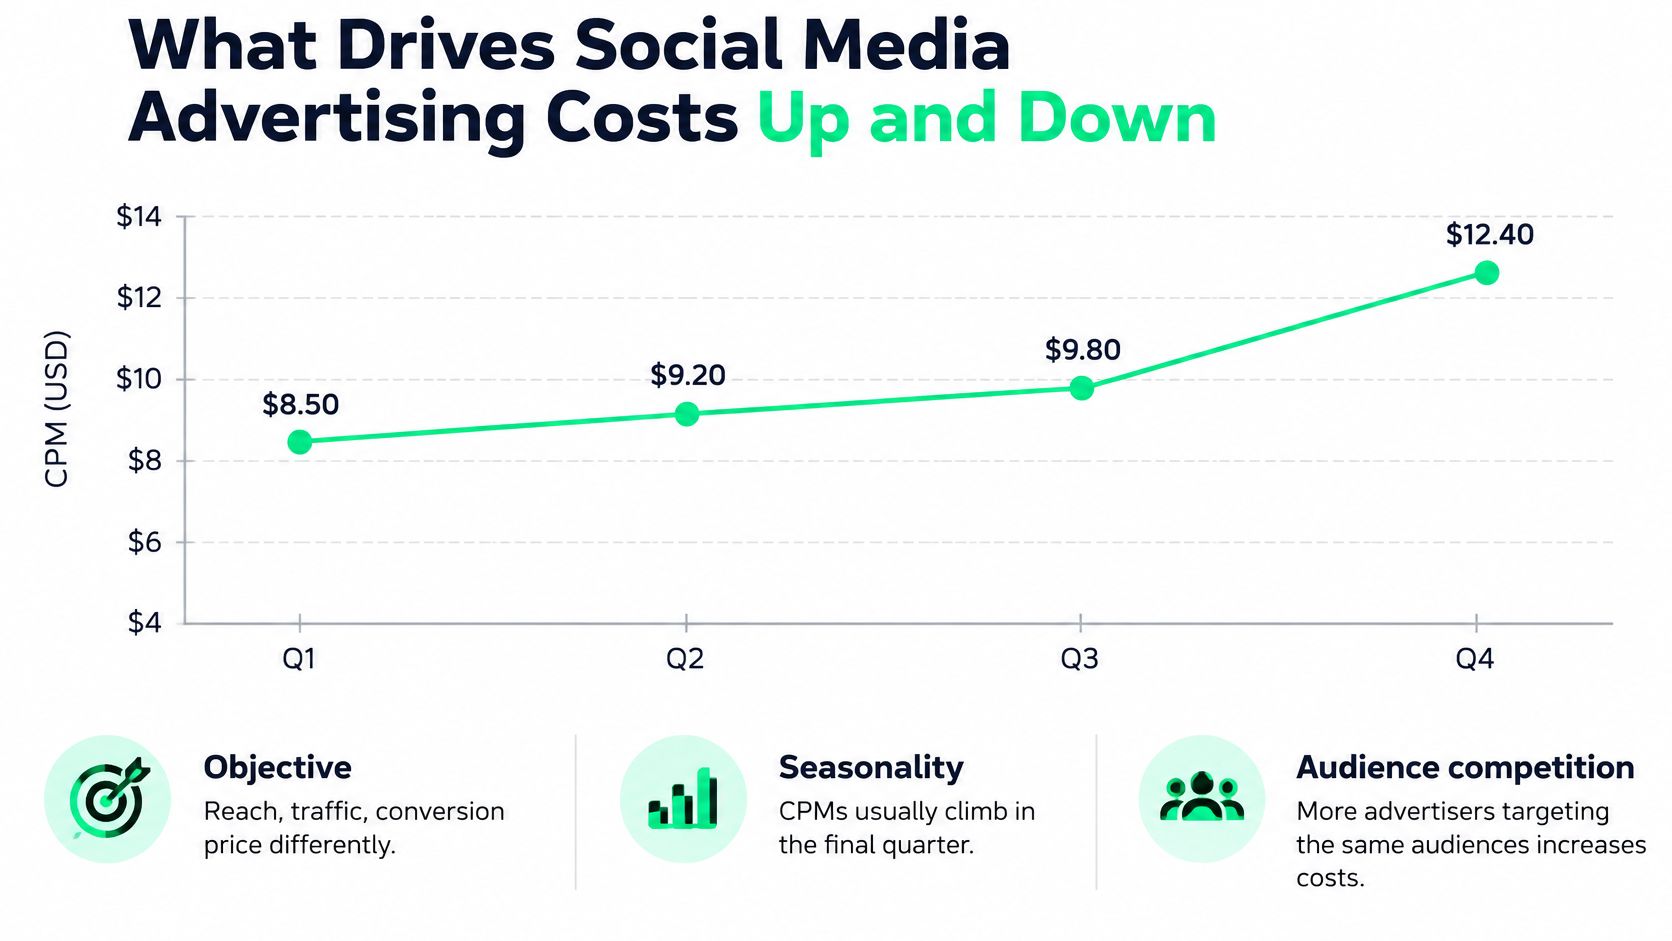
Season and geography change the comparison
Statista's worldwide CPM tracking covers Q1 2024 through Q1 2025, notes that CPM is usually higher in the final quarters, and reports global impression volume improving year over year by close to 10%. That's evidence of a recurring seasonal pattern, not a current quote for your account.
Holiday buyers compete for inventory while consumers are shopping. More available impressions don't guarantee lower prices if advertisers increase demand faster. Prepare seasonal creative before the expensive window, rather than paying peak auction rates to discover which offer works.
In the same Statista comparison, the United States had the highest Facebook CPM among selected countries in February 2025, while India had the lowest; its global Facebook CPC was roughly $0.67 at the end of 2024. A global average therefore makes a weak benchmark for an American-only campaign.
Keep US delivery separate from other approved tier-1 markets. Canada and the UK may fit a campaign, but they shouldn't count as American reach. Require country-level reporting even when all approved countries are commercially attractive.
Audience concentration and creative affect effective cost
Narrow targeting can improve relevance while reducing your room to buy efficiently. Sports, finance, and gaming buyers should examine whether restrictions identify valuable prospects or shrink an already competitive audience.
Creative fatigue creates another problem. When the same audience repeatedly sees an exhausted asset, a cheap impression can become an expensive qualified visit. Test a new opening, demonstration, or offer before assuming the targeting needs rebuilding.
- Audience decisions: Broaden only when the additional users can plausibly become customers.
- Creative decisions: Change the message or execution, not just the thumbnail.
- Placement decisions: Remove unsuitable environments even when their delivery looks inexpensive.
For a visual discussion of paid-social buying, use this accompanying video.
Planning rule: Benchmark against your own geography, quarter, and objective. A blended global average isn't a US buying strategy.
Re-benchmark quarterly, and distinguish changes in auction price from changes in creative effectiveness. They require different fixes.
How Industry Demand Changes Budgeting
Industry labels don't establish a clearing price. An ecommerce prospecting campaign and an abandoned-cart campaign can have different economics even when they sell the same product. Use sector benchmarks to stress-test your budget, not to excuse poor acquisition performance.
Skai's Q3 2026 Quarterly Trends Report puts blended paid-social CPM near $5.75, up 20% year over year, with most industries increasing 14%–21% and Jobs & Education rising about 49%. That blended figure isn't an American-only campaign quote.
Industry cost patterns and 2026 signals
| Industry | Demand pattern | 2026 signal | Budgeting move |
|---|---|---|---|
| Ecommerce / DTC | Dense auctions; repetitive creative can waste delivery | Costs track the blended upward trend, and creative fatigue decides who overpays | Review creative weekly; replace assets when qualified-outcome costs deteriorate |
| Finance / fintech | Valuable customers; compliance limits messaging | Higher acquisition costs are tolerable where customer value supports them | Pre-clear claims and set acquisition limits from customer economics |
| Gaming / igaming | Launch-driven demand and platform-policy constraints | Spend concentrates around releases instead of pacing evenly by month | Cap exposure around releases and events |
| Sports / betting | Concentrated attention around fixtures and storylines | Demand spikes compress into event weeks | Reserve funds for event weeks and approved replacement creative |
| Jobs & education | Hiring and enrollment windows concentrate demand | Sharpest named sector increase in the report | Test off-peak delivery where lead quality remains acceptable |
The demand patterns are buying analysis, not measured industry premiums. Finance advertisers may tolerate higher acquisition costs because customer value supports them. That tolerance says nothing about what any single fintech impression deserves to cost.
Sports and betting buyers face a different constraint: timing. A message can be relevant before a fixture and useless afterward. Pre-approved alternative captions and clear stop times prevent spending on stale context.
Build scenarios instead of defending one forecast
I would treat these as illustrative budgeting rules, not market statistics:
- Base case: Use your current US campaign forecast and expected qualified-delivery share.
- High-competition case: Model a 20% CPM buffer while holding conversion assumptions unchanged.
- Seasonal case: Reserve extra funding for holiday or launch windows, but release it only when qualified outcomes justify expansion.
- Contingency: Hold 15%–25% aside for learning, replacement creative, and delivery disruption.
Keep contingency separate from the high-competition scenario so finance doesn't accidentally count the same reserve twice. A scenario tests affordability; a contingency provides available cash.
Regulated advertisers must confirm applicable local rules, platform eligibility, age restrictions, and permitted claims before launch. Content approval isn't legal authorization to advertise.
Reconcile planned and actual costs monthly, including creative production and verification where applicable. If CPM rises while qualified outcomes improve, the campaign may still deserve more budget. If reach gets more expensive and customer quality deteriorates, reduce exposure rather than defending the original media plan.
Creator Networks and the Cost of a Verified US View
Creator networks deserve a serious test when the job is tier-1 American attention at scale. The model coordinates distribution across vetted pages instead of asking a brand to negotiate, brief, approve, and reconcile each creator separately.
FindClout's network-wide product placement on meme, news, and sports clips has a $0.20 CPM ceiling. Product placement scoped to a sports or finance vertical has a $0.25 CPM ceiling, while content campaigns built from brand assets are priced at $1.50–$3.00 CPM.
The comparison graphic illustrates the difference in billing models; its displayed prices aren't our rate card.
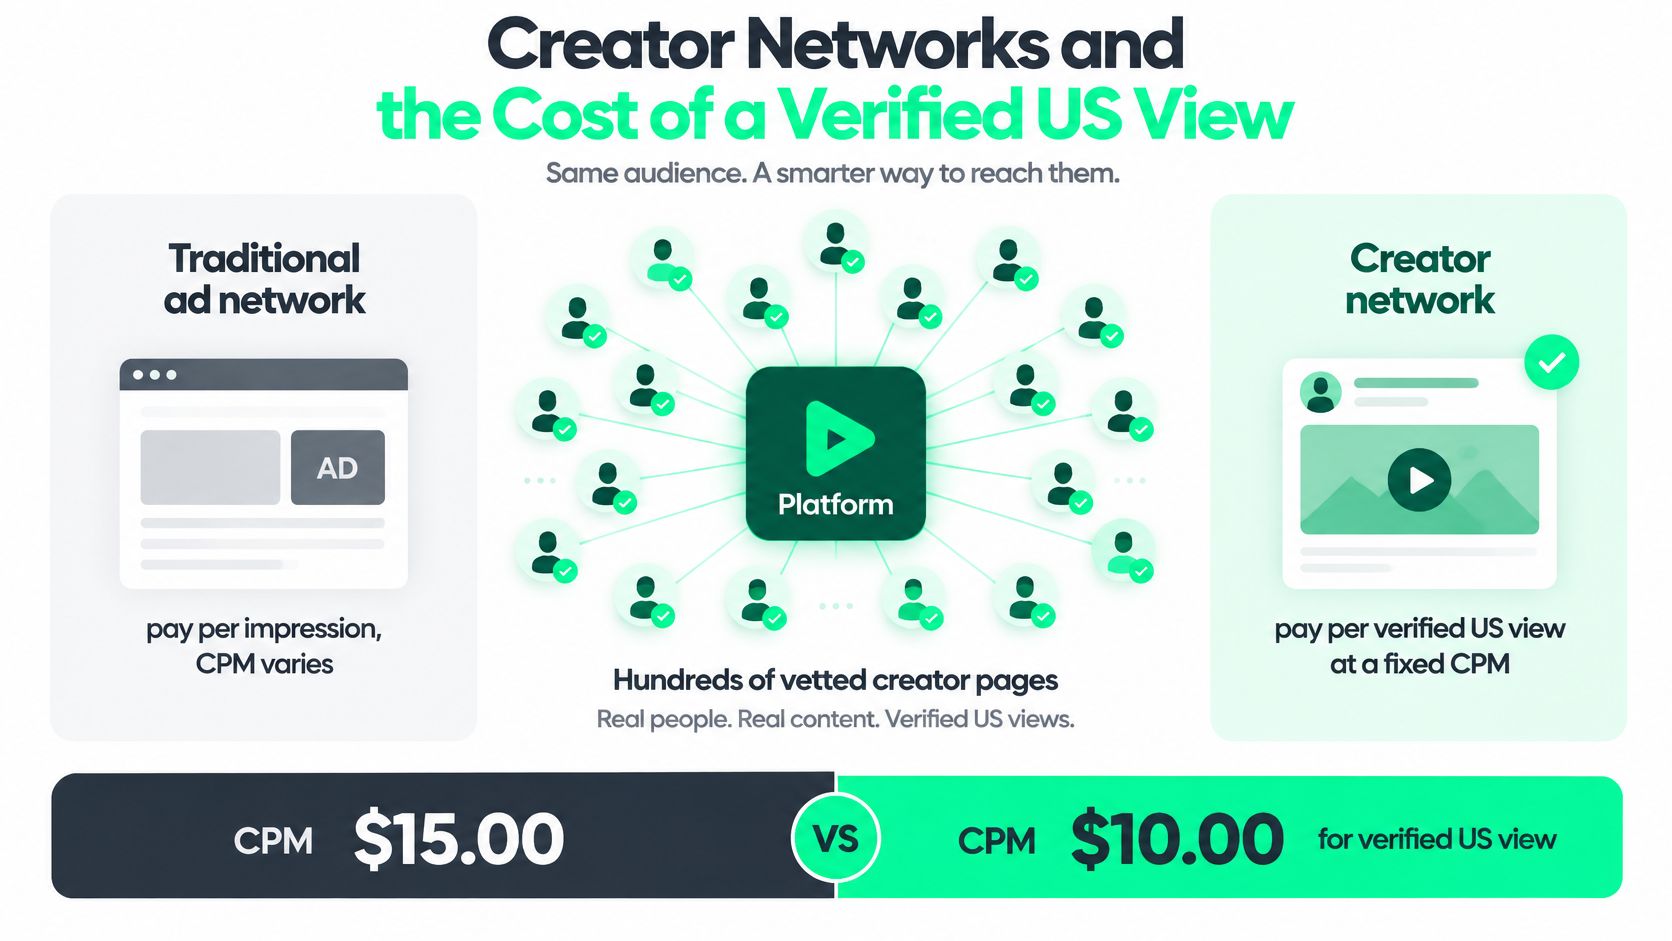
Cheap distribution needs expensive attention to detail
The price gap is useful only if the audience and environment qualify. Our focus is American audiences and high-quality geographies, with geo filters for the US, Canada, and UK kept explicit in the campaign rules.
Creators submit screen recordings and screenshots of audience-analytics dashboards during applications. Those records help evaluate audience composition, while performance reporting lets buyers inspect which handles contribute delivery. A sports-page label alone doesn't establish American sports-fan reach.
Pew Research Center's 2025 US adult survey found that 71% had used Facebook, 50% Instagram, 37% TikTok, 25% Snapchat, and 21% X. These are population usage benchmarks, not evidence that any particular creator reaches the right audience.
Our review system combines AI scoring averaging approximately 1.2 seconds with 24/7 human review before posting. Every submission goes through the live review workflow, and nothing goes live until the brand signs off on the look.
- Brief-level controls: Required captions, keywords, prohibited topics, and banned claims establish what qualifies.
- Page-level controls: Minimum-follower requirements, geographic filters, and removal of off-brand pages govern distribution.
- Publication controls: Paid-promotion disclosure, such as #ad, appears in every brief; creators are contractually responsible for following it.
- Billing controls: Pending and rejected posts aren't billed. Only approved posts count toward spend.
The ANA's Q3 2025 Programmatic Transparency Benchmark found 99.1% of measured programmatic ad spend occurred in low-risk environments. That's an independent example of measurable suitability reporting, not a result for our creator network.
Separate tracked views from qualified American attention
Our effective CPM divides the brand's total paid by every tracked view on approved posts, expressed per thousand views. Views beyond each post's cap are free, so overdelivery can reduce that effective rate.
That commercial calculation isn't automatically the normalized US-only calculation. For the latter, count only verified American views meeting the agreed placement standard. Report other approved geographies separately.
Brand protection: Scaling toward billions of views requires review rules that remain enforceable at volume, not a promise to inspect a sample afterward.
Creator distribution is the channel I would test for sports, gaming, and finance awareness. Keep conversion campaigns alongside it when purchases or registrations are the ultimate goal. Cheap verified attention is valuable, but it isn't a substitute for measuring customer behavior.
Choosing Channels by Budget and Objective
Budget decides the objective as much as the objective decides the budget. A consumer app buying registrations needs different evidence from a sports brand buying launch visibility, even when both want American users. Pick the outcome you can afford to measure first, then give each channel one job.
The budget bands below are illustrative allocation starting points, not platform minimums or promises of performance. Our launch pilot runs on separate commercial terms.
Channel choice by objective and monthly budget
| Objective | Monthly budget | Lead channel | Support channel | Cost logic |
|---|---|---|---|---|
| US reach and awareness | Illustrative $20K+ | Creator networks | TikTok | Fixed verified-view buying makes qualified reach easier to budget |
| Conversions and ROAS | Illustrative $10K+ | Meta (Facebook / Instagram) | TikTok | Optimize purchases and validate customer value |
| Traffic and sign-ups | Illustrative $5K+ | Meta (Facebook / Instagram) | TikTok in-feed | Compare qualified sessions and completed registrations |
| Launches and sports moments | $20K–$30K pilot | Creator networks | X | Guaranteed-view pilot with live conversation support |
| Regulated verticals such as fintech and crypto | Illustrative $20K+ | Vertical-scoped creator placement | Meta retargeting where permitted | Control context, geography, and approved claims before expanding |
Our first campaign costs $20K–$30K, guarantees 100M views, and arrives as one flat invoice. Vertical-scoped placement on sports or finance pages carries a $0.25 CPM ceiling and stays inside that one vertical, while network-wide placement on meme, news, and sports clips caps at $0.20 CPM. Write the geographic qualification and reporting requirements into the agreement rather than letting the headline guarantee stand in for them.
A brand gives us its budget and goal, whether reach, sign-ups, or a launch moment, and we return a plan with a guaranteed view number. The initial decision becomes concrete: which audience, which eligible delivery, which approved message, which downstream measurement.
Give each channel a defined job
Meta is my default lead for purchase intent. Its conversion workflow connects ad delivery with a product catalog, landing page, and purchase event in a way the other channels can't match at this budget. That recommendation still needs validation against your margins and customer quality.
Creator networks are where I'd put the awareness test budget. You pay per view at a CPM set up front, so the reach line item stays predictable while you learn. Judge the channel on verified US views and qualified downstream behavior, not last-click attribution alone.
TikTok is the creative-testing support channel. Use native demonstrations, direct hooks, and clear offers to learn what earns attention. Cheaper impression benchmarks don't prove it's universally the cheapest place to test.
X earns budget around live conversation. Give it a specific event, a relevant message, and a defined stopping point. An always-on allocation with no role is a slow leak.
- For ecommerce: Keep prospecting and retargeting performance separate, or one masks the other's failure.
- For consumer apps: Measure activated users, not installs or completed forms.
- For regulated products: Confirm advertising eligibility before assigning creator distribution or retargeting spend.
Pick the closest objective row and fund one meaningful test. Spreading a small budget across every platform produces more dashboards than decisions.
How to Set and Stress-Test Your Budget
A useful budget defines what you'll buy, how you'll verify it, and what will make you stop. It doesn't just divide money among platforms.
Use this as an illustrative operating plan, adjusting the test duration to your conversion cycle and available volume.
Choose one primary metric. Use verified-US-view CPM for attention, cost per qualified visit for traffic, or CPA for acquisition. Keep the other metrics as diagnostics rather than competing definitions of success.
Assign a lead, support, and test role. A hypothetical 70/20/10 split gives the main channel enough funding to produce interpretable results. Don't force that split when a guaranteed-view pilot requires a different commitment.
Stress-test affordability. Apply the competitive and seasonal scenarios to the full campaign cost. Include production, verification, and internal review work where those costs apply, not just media delivery.
Establish the stopping rules before launch
Run comparable learning flights. A hypothetical two-week flight can suit a fast-moving consumer campaign, but slower sales cycles need longer observation. Hold geography, creative theme, and attribution window constant, and retain the delivery records needed for reconciliation.
Reconcile and act. Review planned versus actual CPM monthly alongside qualified outcomes. A practical stop rule is to pause a channel after two adequately measured flights miss the target, unless a documented fix justifies another test.
Scale with commercial control. We charge per view at a CPM set up front. That fixes the agreed unit rate, while your approved geography, placement rules, and delivery definition determine what the rate buys.
Use our marketing budget allocation guide to translate those decisions into a working plan. Keep a named owner for creative approval, another for measurement, and a shared record of exclusions and changes.
Choose the objective row that matches your business, size the pilot against a qualified-view target, and evaluate a quarter of results rather than a single headline CPM. The winning channel is the one that delivers acceptable American attention and profitable outcomes without compromising your brand.
FindClout offers coordinated creator distribution with upfront CPM pricing, verified-view billing, and submission-level brand controls focused on American audiences. Visit FindClout with your budget, target geography, and reach, sign-up, or launch objective to get a campaign plan with a guaranteed view number and clear approval rules.
Want this audience for your brand?
FindClout puts your brand in front of verified American audiences across every major US page — brand-safe, at scale.
Start Your Campaign