 findclout.com
Facebook Ads Cost in 2026: CPM, CPC and CPA Benchmarks
The average Meta CPM across Facebook and Instagram came in at $8.32 for 2025, and the average link click cost $0.85. Both are benchmarks built from a year of live auction data, not rate cards you can hold a platform to.
Ask five media buyers what Facebook ads cost and you'll get five numbers, all defensible. One bought ecommerce impressions through a sample of more than 40,000 brands, another ran U.S. lead campaigns, a third quoted a global average that blended markets where an impression costs pennies. The disagreement isn't sloppiness. It's the auction doing its job, pricing each impression against the objective, the geography and the creative in front of it.
The number that deserves your attention isn't CPM. It's cost per outcome, and the only honest way to compare that across Facebook and a fixed-price distribution buy is to match the objective, the market and the measurement window first. Skip that step and a cheap impression looks like a bargain right up until it produces nothing.
Table of Contents
- Facebook Ads Cost at a Glance
- How Facebook's Auction Sets Your Price and Which Drivers Move It
- Bid Strategies Are Cost Controls, Not Discounts
- Why Facebook Ads Cost Benchmarks Disagree
- What Brand Safety Controls Do to Your Effective CPM
- Facebook Ads Auction vs Fixed-CPM Distribution
- How to Set Your Budget and What to Do Next
Facebook Ads Cost at a Glance
Facebook ad benchmarks vary by objective and sample. The figures below show several reference points, but they are not interchangeable: some measure an average, others a median, and their samples cover different advertisers and campaign types.
Facebook ads cost benchmarks by metric
| Metric | What it measures | Reference value | Context |
|---|---|---|---|
| CPM | Cost per 1,000 impressions | $8.32 average | Gupta Media, Facebook and Instagram, 2025 |
| CPM (ecommerce median) | Cost per 1,000 impressions | $15.06 median | Triple Whale, 40,000+ brands, Aug 2025 to Jul 2026 |
| CPC (link click) | Cost per link click | $0.85 average | Gupta Media, 2025 |
| CPC (traffic campaigns) | Cost per click | $0.60 median | WordStream, U.S., Apr 2025 to Jun 2026 |
| CPC (lead campaigns) | Cost per click | $1.80 median | WordStream, U.S., Apr 2025 to Jun 2026 |
The ecommerce CPM median is higher than the overall average, while the reported lead-campaign CPC is higher than the traffic-campaign CPC. Those comparisons describe different samples and objectives, not a universal price premium for every ecommerce impression or lead click.
The table does not provide vertical-specific benchmarks for sportsbooks, prediction markets, fintech, or gaming. A reported lead-click price cannot tell an operator what a depositor will cost in a particular market.
A $5 CPM can still produce a higher cost per sale than a $15 CPM if the cheaper impressions generate fewer clicks or conversions. Compare outcomes over the same measurement window and against the same campaign objective. For a wider view of buying attention beyond Meta, see these alternatives to Facebook ads.
How Facebook's Auction Sets Your Price and Which Drivers Move It
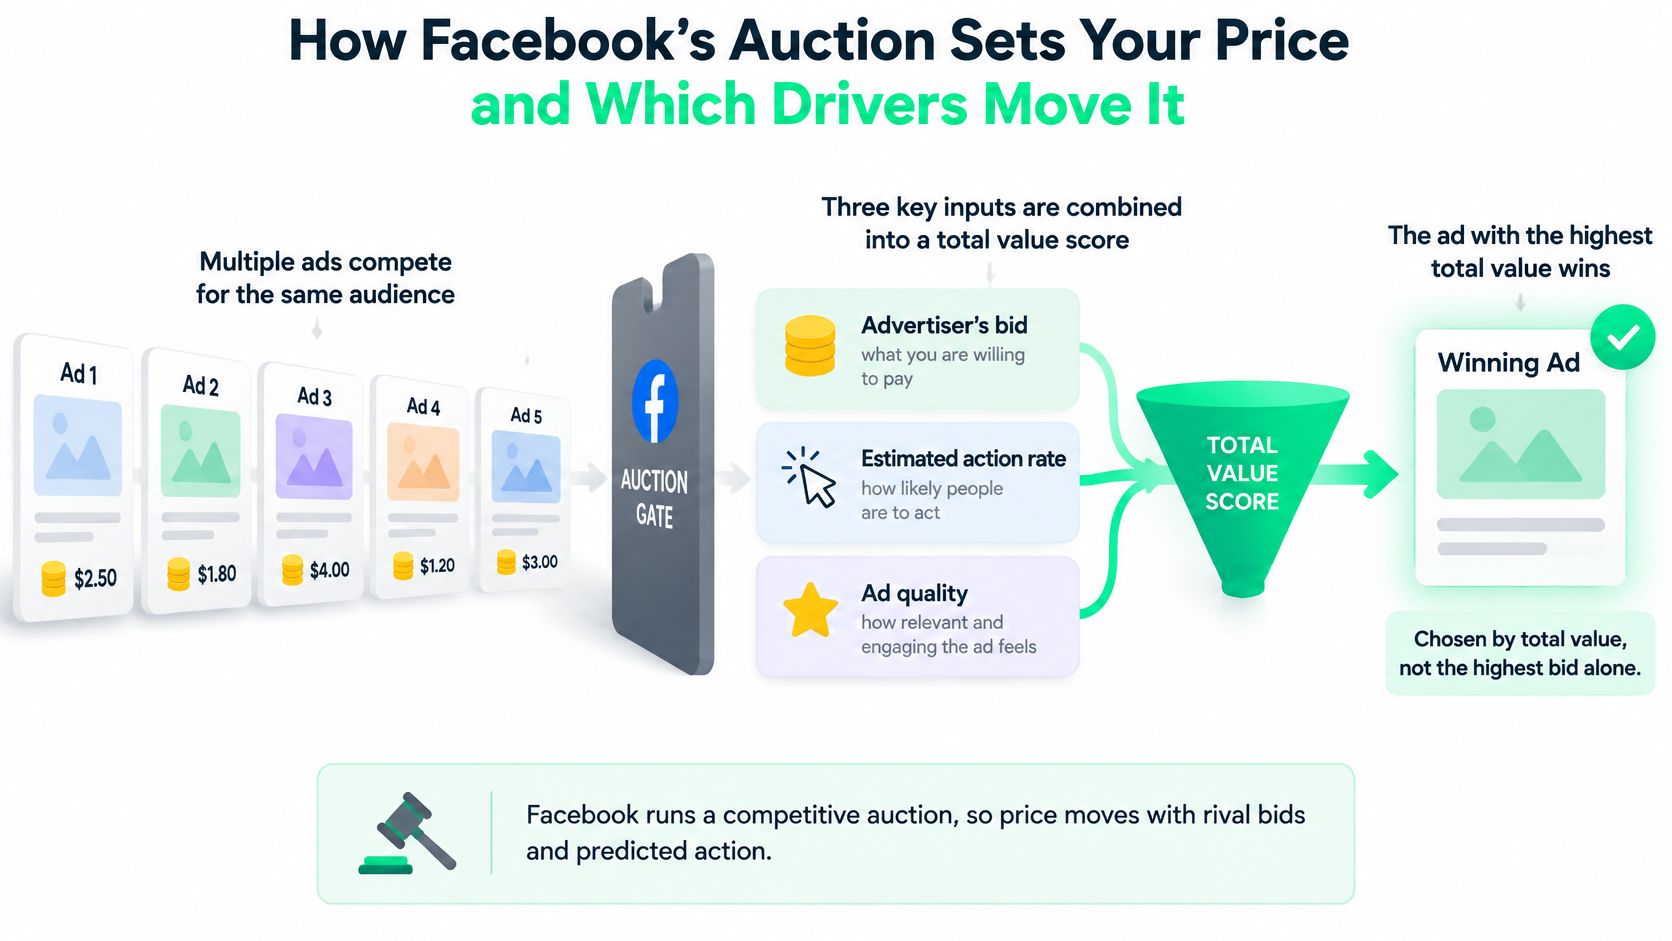
Picture a gate with five cars arriving at once and one lane open. Every advertiser in the queue is bidding for the same impression, but the guard doesn't wave through whoever paid the most. Meta's explanation of the Facebook ads auction lays out the core rule: the winning ad is the one with the highest total value, a score assembled from three inputs.
- Your bid: what you're willing to pay for the outcome you selected.
- Estimated action rate: how likely Meta thinks this person is to take that action.
- Ad quality and relevance: how the ad performs against other ads aimed at the same person.
Two advertisers chasing the same U.S. audience can land very different prices on identical targeting. Say a supplement brand bids $3 with a sharp hook, a fast landing page and a predicted conversion rate that makes delivery optimistic. A second advertiser bids $5 with a vague creative and a checkout that takes nine seconds to load. The $3 bid can win the impression outright, and it pays only what the auction needed to win, which is often well below its maximum.
Cutting your bid in half doesn't halve your cost either. Meta's auction documentation is explicit that a stronger predicted conversion rate or better user feedback can beat a higher bid, and that the auction won't charge more than your bid. Shaving bids is the slowest route to a lower CPM. Improving what the ad promises is the fastest.
Seasonality Moves Price More Than Your Settings Do
The swing that wrecks annual budgets is the calendar, not the campaign. Gupta Media's 2025 paid social benchmarks show the average CPM at $6.05 in January 2024, $8.11 in June, $10.83 in December 2024, then $10.02 in December 2025. That January-to-December climb is roughly 79% for the same platform and roughly the same buyers.
The same dataset reported a 1.18% link-click-through rate for 2025. That's where an impression price becomes a click price, and it's the figure that decides whether your Q4 plan survives contact with December.
The Drivers Ranked by How Much You Control
- Creative quality. You own this completely. Weak ads lose auctions and pay more for the same placement.
- Campaign objective. Conversion campaigns often carry a higher CPM because delivery is buying people who look like buyers, not people who look like clickers.
- Audience size and saturation. A narrow audience with frequency above 3 means you're bidding against yourself.
- Placement mix. Feed, Reels and Audience Network price differently, so a blended CPM describes a blend, not a rate.
- Market. U.S. inventory costs more than lower-demand geographies, and that gap is bigger than most account-level optimizations.
- Vertical competition. Sportsbooks, prediction markets, fintech and gaming bid for overlapping users, and in a launch week you feel every one of them.
Pre-launch check: confirm the objective matches the business result, pick one bid strategy, confirm the creative would stop your own scroll, and write down which market you're buying before you publish.
Every driver here is a lever to test, not a fixed price. A rising CPM with a stable cost per result is not a failure. It's usually the auction handing you better buyers. If you're mapping these levers against other channels, this guide to social media ad buying shows how the same drivers behave outside Meta.
Bid Strategies Are Cost Controls, Not Discounts
Bidding strategy isn't a discount code. It's the instruction that tells delivery what a result is worth to you, and it decides what the system will pay per impression to get one.
Bid strategies and when each fits
| Strategy | Best for | Trade-off | Cost control |
|---|---|---|---|
| Lowest cost | Finding volume quickly | Spend chases the cheapest results and quality can slip | No hard ceiling per result |
| Cost cap | Keeping average cost per result stable | Delivery slows when the cap is set tight | Average cost target per result |
| Bid cap | Strict limits on auction bids | Can starve delivery in competitive auctions | Maximum bid per auction |
| Minimum ROAS | Revenue-led purchase campaigns | Needs reliable conversion data to work | Minimum return on ad spend |
The mechanics behind paid delivery explain why a conversion campaign can look worse on paper and work better in the P&L. Meta states its delivery system may select higher-cost impressions when doing so is expected to produce a lower conversion price. CPM can climb while cost per acquisition falls. That's the system doing what you asked.
Setting a Cost Cap From a $40 Target
Say a DTC brand sells a $40 product and wants to keep acquisition under $40 per purchase. Open the campaign with a cost cap at $40 and let it run. Tighten it to $35 only after roughly 50 conversions, because before that the average is noise and you'll be reacting to two good days and one bad one.
Two errors break this more often than anything else. Changing bids daily keeps the ad set permanently in learning, where the system spends your budget relearning instead of optimizing. And judging a conversion campaign by its CPM or CPC is measuring the wrong line: those metrics describe impressions and clicks, while the campaign is buying purchases.
If the cost per result holds across a full week, the bid is right even when the CPM looks ugly.
Before you touch anything, run a four-item check. Confirm the objective matches the action you're paying for. Use one strategy per campaign so results stay attributable. Set the cap from your target cost per result, not from last month's average. And review cost per result over seven days, not seven hours.
Why Facebook Ads Cost Benchmarks Disagree
Read three benchmark posts in one afternoon and you'll come away believing Facebook ads cost three different things. The gap isn't error. It's scope.
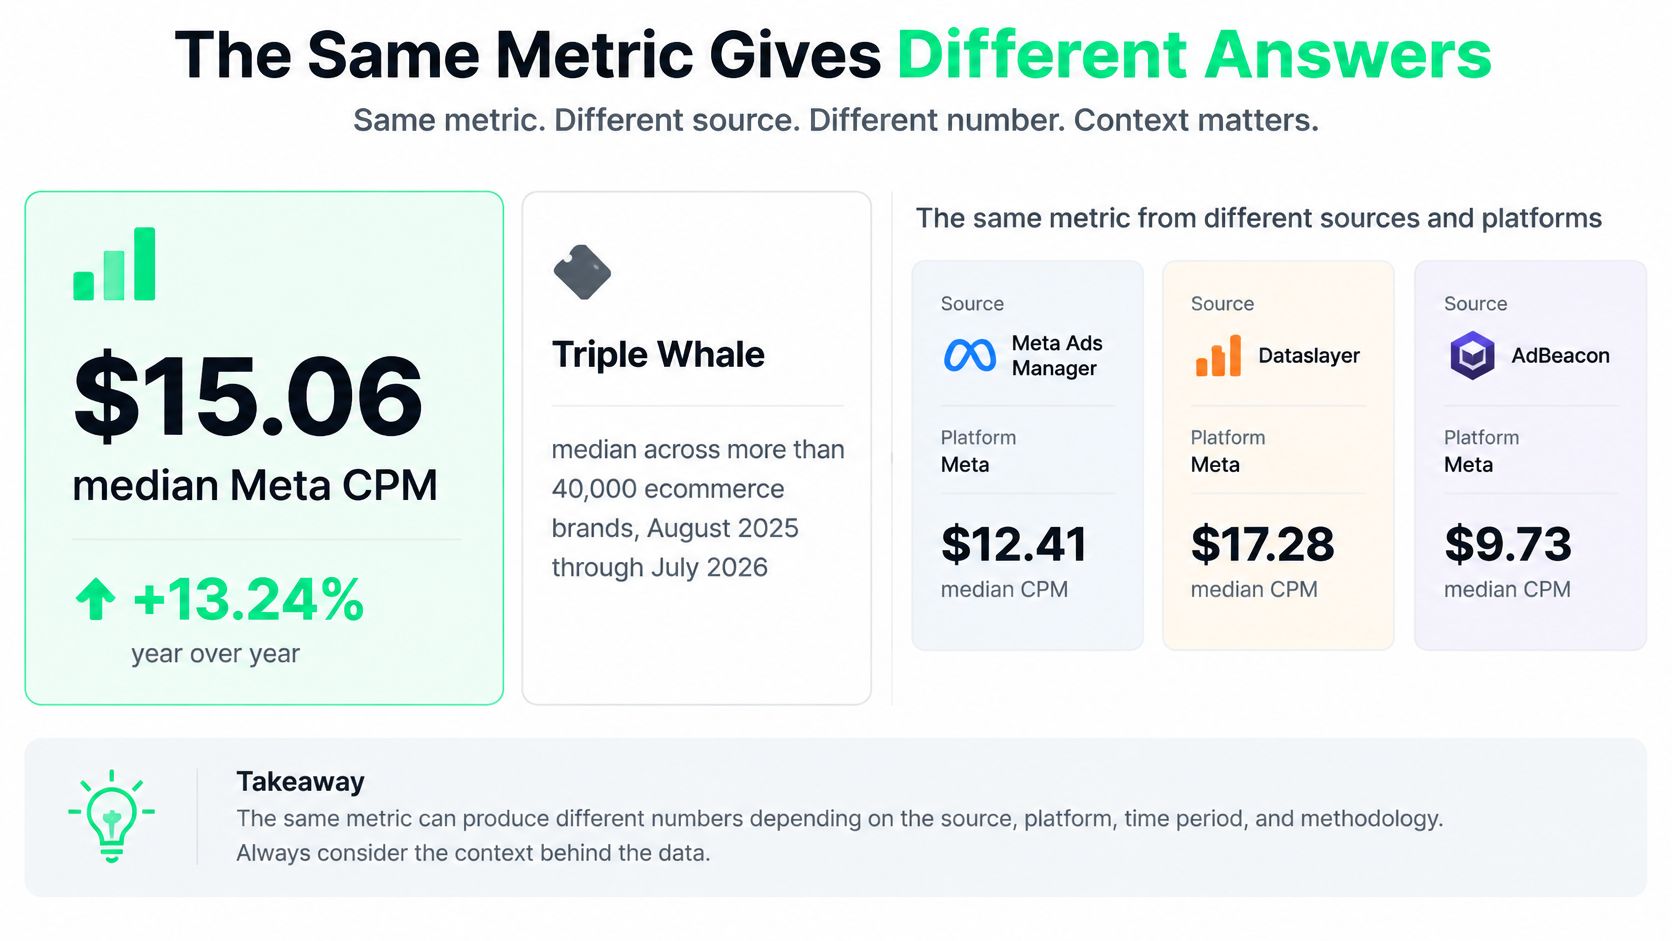
An all-industry average and an ecommerce median, published a year apart, can differ by nearly a factor of two without either being wrong. They're measuring different advertisers buying different outcomes in different months.
Triple Whale's Facebook benchmarks show the squeeze a single CPM number hides. Across its sample of more than 40,000 ecommerce brands, median CPM rose 13.24% year over year while conversion rate fell 4.73%. Cost per acquisition therefore climbed faster than the impression price, which is the part a CPM dashboard never tells you.
Geography does the same thing on a bigger scale. The same body of work puts the U.S. ecommerce median at $16.08 against $1.36 in India. Blend those two into one global average and you've produced a number that describes no advertiser on earth.
Normalize Seven Inputs Before You Compare Anything
- Market: country and region, not "global."
- Objective: traffic, leads and purchases are three different auctions.
- Placement: feed, Reels, Stories and Audience Network price separately.
- Attribution window: 1-day click and 7-day click count different purchases.
- Optimization event: a landing-page view and a purchase are not the same signal.
- Audience temperature: cold prospecting and retargeting belong in separate rows.
- Measurement period: a holiday month isn't a quarter.
The Click Math That Reverses the Ranking
Here's the calculation most benchmark comparisons skip. A campaign at a $6 CPM with a 0.8% click-through rate spends $6 to earn 8 clicks per 1,000 impressions, which is $0.75 per click. A campaign at a $12 CPM with a 2.1% click-through rate earns 21 clicks from the same thousand impressions, which is about $0.57 per click. The more expensive impression is the cheaper click.
Run the same logic one step further and you get cost per sale. Cheap inventory that converts badly is expensive acquisition wearing a low CPM badge. Build your forecast as a range from comparable sources, market by market and objective by objective, then hold your own account to the midpoint rather than to somebody else's headline.
What Brand Safety Controls Do to Your Effective CPM
Brand protection can reduce reach and raise CPM. The trade-off is justified when the controls remove placements that would undermine the campaign, but the cost should be measured against qualified outcomes.
The Reach You Give Up for Control
Meta's inventory filter documentation describes three levels. Expanded allows ads beside all content that meets Meta's Content Monetization Policies. Moderate excludes highly sensitive content, while Limited applies stricter exclusions.
Meta warns that Moderate and Limited settings can reduce reach and increase costs. Compare settings with the same audience, objective and measurement period, then judge cost per qualified action alongside CPM. If a tighter filter raises acquisition cost but removes placements your brand would reject, the higher CPM may be a sound trade.
Default Rules, Added Controls and Placement Gaps
Meta excludes some high-risk categories by default, including excessively controversial or offensive material, full nudity, excessive violence, terrorist acts and misinformation identified as false by third-party fact-checkers. Advertisers can add publisher block lists, content-type and topic exclusions, and manual placement controls through Meta's brand safety settings.
Those controls do not guarantee that every adjacent publisher or item of content meets a brand's own suitability standards. Placement also matters: Meta's brand suitability guidance distinguishes feed, in-content and Audience Network placements, and settings may not apply uniformly across them. A block list that covers one surface may leave another unaffected, so review delivery by placement rather than assuming one setting protects the whole campaign.
Validate the Audience, Not Just the Impression Count
Facebook has broad U.S. reach, but a platform-wide audience figure cannot show whether a particular campaign reached its target. Placement and geographic reporting answer that question more directly than impressions alone.
Monthly routine: Review the placement report, remove pages and surfaces producing unqualified actions, and compare cost per qualified action with CPM. CPM alone can make unsuitable inventory look efficient.
Facebook Ads Auction vs Fixed-CPM Distribution
Facebook's auction prices delivery as campaigns compete for audiences and outcomes. Fixed-CPM distribution sets a price per view in advance. The difference is more than pricing: the auction charges for delivery, while FindClout bills only for approved posts and runs additional posts if needed to reach the purchased view count.
Facebook ads auction versus fixed-CPM distribution
| Factor | Facebook ads auction | FindClout fixed-CPM distribution |
|---|---|---|
| Pricing model | Competitive auction; price set by rival bids and predicted action | CPM set up front for each verified view |
| Price | No published ceiling; price moves with rival bids and seasonal demand | $0.20 CPM for network-wide meme, news and sports clips; $0.25 CPM for vertical-scoped placement |
| Billing for unapproved content | Charged for delivery as it happens; no rebate for weak results | Pending or rejected posts are never billed |
| Delivery guarantee | None from the auction | Additional posts run until the purchased view number is reached |
| Audience focus | Advertiser-defined targeting across Meta | Campaign-specific creator approvals and geo filters for the U.S., Canada and the UK |
| Measure of cost | Cost per result | Effective CPM: total paid divided by tracked views on approved posts |
The fixed CPM makes the distribution cost easier to forecast, but it does not make the two channels directly comparable. Meta's cost per result depends on the campaign objective and the actions users take. A view-based buy should therefore be judged on cost per outcome too, not just on its lower headline CPM.
Campaign briefs can set required captions and keywords, banned claims, and other rules. Posts that break those rules are rejected and unpaid. Creators apply to each campaign, and approved posts run on their own pages.
The trade-off is clear: Meta offers auction-based delivery optimized toward the chosen outcome, while fixed-CPM distribution offers a pre-set price and a purchased view number. A launch or reach campaign may benefit from that predictability; a conversion campaign still needs to prove that views lead to valuable actions.
Use both channels when their roles are distinct. Meta can optimize for a tracked conversion, while distribution can buy a defined volume of views. Compare them by the outcome that matters to the campaign, since a cheaper CPM alone does not show which channel delivers more value.
How to Set Your Budget and What to Do Next
Set the budget against cost per outcome and the CPM argument disappears. Three steps get you there.
Step one, pick the metric that matches the goal. CPM for awareness, CPC for traffic, cost per purchase for sales. Buying awareness and judging it by purchases is how good campaigns get killed.
Step two, compute break-even per result from margin. A $40 product at 40% margin leaves $16 to spend on acquisition before the sale stops making money. That $16 is the ceiling for every campaign you run, on any platform, at any CPM.
Step three, run a two-week test in each channel. Compare effective cost per outcome in the same geography and attribution window, using the seven normalization inputs that make a comparison honest. If you need a framework for splitting spend across channels, this guide to allocating a marketing budget walks through the split.
For verified U.S. attention on a launch, a fixed-CPM route can be tested against the same break-even using effective CPM, which is total paid divided by every tracked view on approved posts, with views past each post's cap free. A brand that needs a set reach number sends FindClout its budget and goal, whether that's reach, sign-ups or a launch moment, and gets back a plan with a guaranteed view number to check against the break-even before committing. First campaigns typically run $20-30K for 100M views on one flat invoice.
Before your next bid change or your next campaign brief, write the break-even cost per outcome on one line and treat it as the ceiling. Every other number is a detail underneath it.
If the auction's moving prices are making your launch plan impossible to forecast, FindClout sells verified views at a CPM fixed before the campaign starts, with tier-1 U.S. audience vetting, pre-approval on every post and 24/7 human review behind the AI screening. Send us your budget and goal and you'll get back a plan with a guaranteed view number you can hold against your break-even. Start at FindClout and see what a known cost per thousand looks like next to a moving one.
Want this audience for your brand?
FindClout puts your brand in front of verified American audiences across every major US page — brand-safe, at scale.
Start Your Campaign