 findclout.com
DTC Advertising Guide: Channel Mix, Creative Tests and CAC
US internet advertising revenue reached $294.6 billion in 2025, up 13.9% year over year, according to the IAB Internet Advertising Revenue Report. In 1996 the same report counted roughly $260 million. Paid digital stopped being an experiment somewhere in that climb.
The size of the number matters less than what it implies. When every brand can buy the same inventory from the same platforms, reach stops being an advantage and proof stops being optional. The advertisers getting profitable growth don't have a secret channel. They have a shorter list of things they're willing to call a result.
What follows is that shorter list. A channel mix defended from contribution margin, a holdout design that survives platform inflation, a creative test that separates memes from native ads, and two gates that no placement clears by default: tier-1 US audience quality and brand safety.
Table of Contents
- Setting a DTC Channel Mix Your Budget Can Defend
- Calculating CAC and iROAS Without Platform Inflation
- Testing Memes Against Native Creative in a Dated Pilot
- Measuring Creator Distribution When Buyers Never Click
- Brand Controls for Programmatic Creator Campaigns
- Scaling Creator Placements Without Wasting Spend
Setting a DTC Channel Mix Your Budget Can Defend
The channel-level split explains more than the total does. The IAB's full-year 2025 report breaks out $117.7 billion for social media advertising, up 32.6%, $78 billion for digital video, up 25.4%, and $63.4 billion for commerce media, up 18%. Those are three different jobs wearing one accounting label.
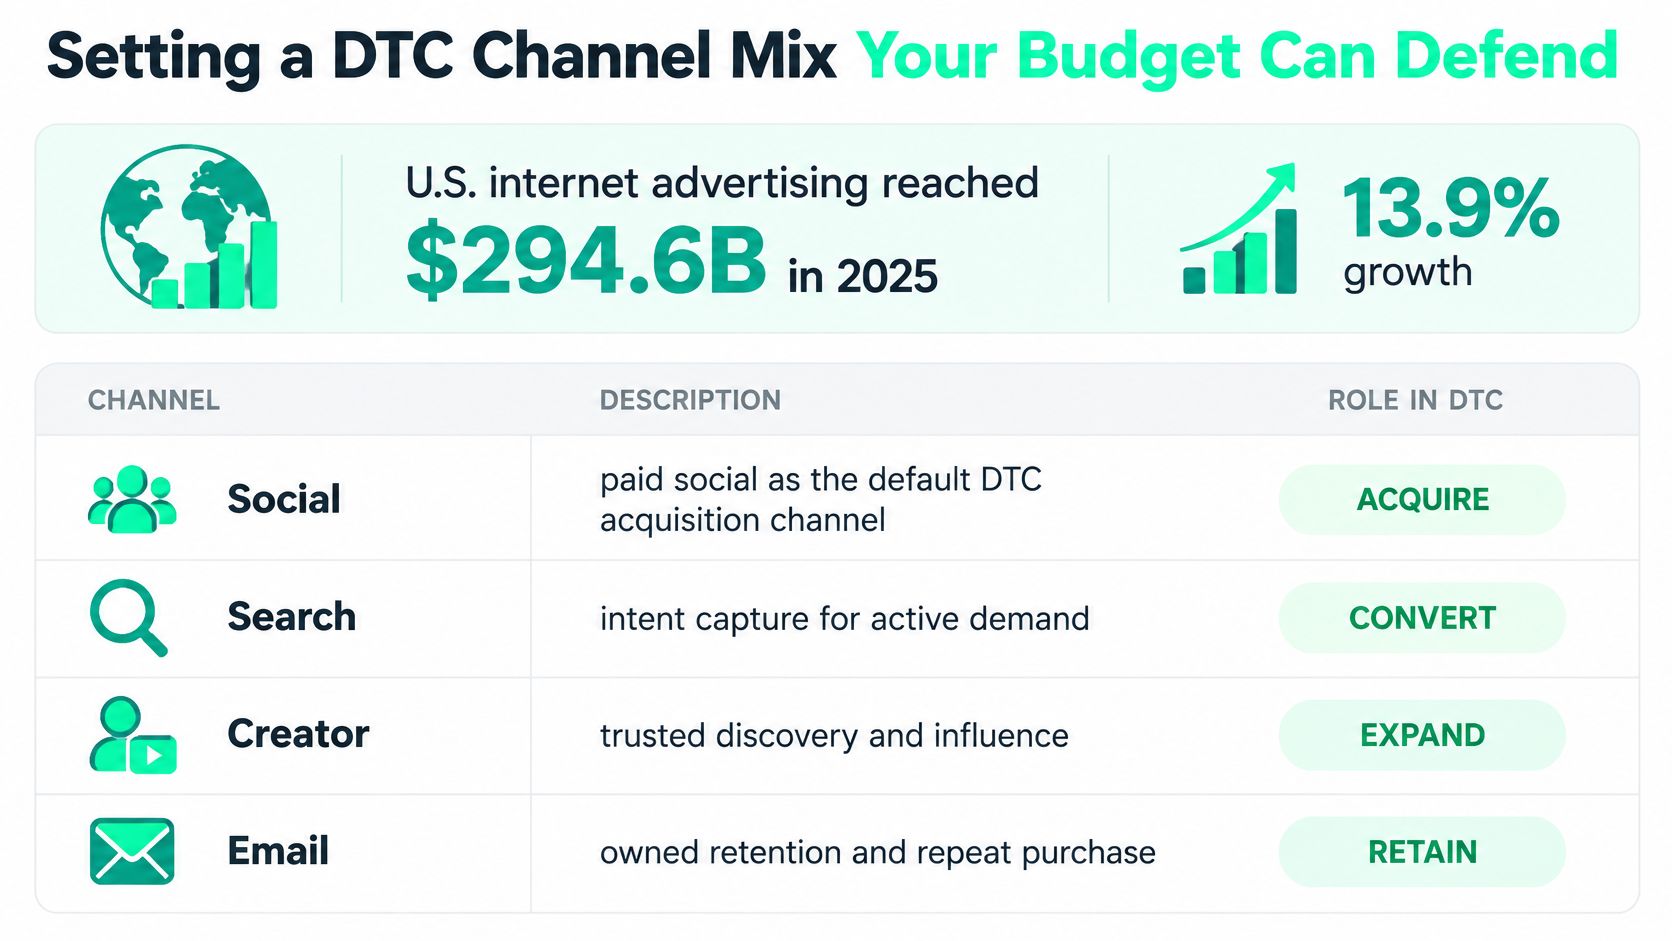
| Channel | 2025 US revenue | Growth | Role in DTC mix |
|---|---|---|---|
| Social media advertising | $117.7B | +32.6% | Prospecting, creator-led reach and discovery |
| Digital video | $78B | +25.4% | Mid-funnel storytelling and retargeting |
| Commerce media | $63.4B | +18% | Shopping-intent retargeting and conversion |
| Total US internet advertising | $294.6B | +13.9% | Market context across all channels |
Size the mix from margin, not from last year's spreadsheet
- Set contribution margin and the maximum CAC it can absorb. Contribution margin is revenue minus product cost, shipping and payment fees. Decide what share of that margin you'll spend to acquire an order, and that number becomes the ceiling every channel is judged against. A channel that beats its own historical CPA while exceeding the ceiling is still losing money.
- Give each channel a job. Social and creator-led distribution buys discovery from people who don't know you exist. Digital video earns consideration and refills retargeting pools. Commerce media and search collect demand that already exists. Blur those lines and capture will win every report while prospecting gets cut first.
- Ring-fence an experiment slice off the top. Testing funded from the core budget gets cancelled the week performance dips, which is always the week the test matters.
For a $500,000 quarterly budget, one workable shape is 40% social prospecting and creator reach, 25% digital video for consideration and retargeting supply, 15% commerce media and search capture, 10% creative and channel experiments protected in advance, and 10% held in reserve that's released only after a holdout confirms lift. Treat that as an illustration to argue with, not a benchmark to copy.
For calibration, 58% of 134 DTC brands and agencies said they put at least 41% of their 2025 marketing budgets into digital channels such as social, search and display, per Digiday and Klaviyo's state of DTC marketing report. That's a sanity check on your split, not a target.
Practical rule: a channel earns its share of the budget when a holdout shows it adds profit. Platform attribution is a claim, and claims get audited.
Three signs the mix is broken. Blended CAC rises while spend rises, which usually means the marginal dollar is buying the same people twice. Prospecting never refills retargeting pools, so mid-funnel spend starts harvesting people who were never reached. And one channel carries nearly all reported conversions, a pattern that describes attribution as much as it describes performance.
If you're reconstructing the plan from scratch, Veo3 AI's advertising planning tips walk through the structural questions worth answering before any channel gets a budget line.
Calculating CAC and iROAS Without Platform Inflation
Two formulas do the work, and both of them refuse to use the platform's conversion count.
Incremental CPA = total spend ÷ incremental conversions. iROAS = incremental conversion value ÷ spend. Everything else, the platform CPA, the reported ROAS, the purchases column, is an input to those two, never a substitute.
Say a brand spends $50,000 in a month and the ad platform reports 800 purchases. That reads as a $62.50 CPA, and it's the number that usually goes into the deck. A geographic holdout then shows that only 300 of those purchases wouldn't have happened without the ads. Incremental CPA is $166.67. Same spend, same 800 purchases, a business case that's nearly three times worse than the dashboard claimed.
Pre-register the test before the money moves
- Name one primary outcome. Incremental purchases, contribution profit, qualified leads. Pick one. Multiple primary outcomes means multiple chances to find a flattering result.
- Pre-register the window, exclusions, budget and minimum detectable effect. Written down before launch, shared with whoever signs off on spend. A test defined after the results arrive isn't a test.
- Randomize users, or match markets with care. Google's experimentation guidance describes the design as a causal comparison between people exposed to ads and a control group that isn't. Where user-level randomization isn't available, geographic testing works only if markets are matched on historical sales, seasonality, media pressure and customer mix before launch.
- Suppress exposure in the control group while normal activity keeps running everywhere else. A holdout that still sees the creative is just a second treatment.
- Let the conversion lag resolve. Google's guidance cites a 7 to 56 day measurement window. Reading results on day 10 because the trend looks good is the most common way a well-built test lies.
View-through and last-click conversions both over-credit ads that reached people who would have bought anyway. Neither is causal, and every metric built on them inherits the error.
When purchase volume is too thin to reach statistical power, measure an upper-funnel action such as add-to-cart or checkout initiation, and say so plainly in the report. Swapping the metric without labelling the swap is how measurement programs lose credibility with finance.
For the cost side of this equation, the mechanics of building a defensible customer acquisition cost model matter as much as the lift test itself. Get both right and the next budget conversation gets shorter.
Testing Memes Against Native Creative in a Dated Pilot
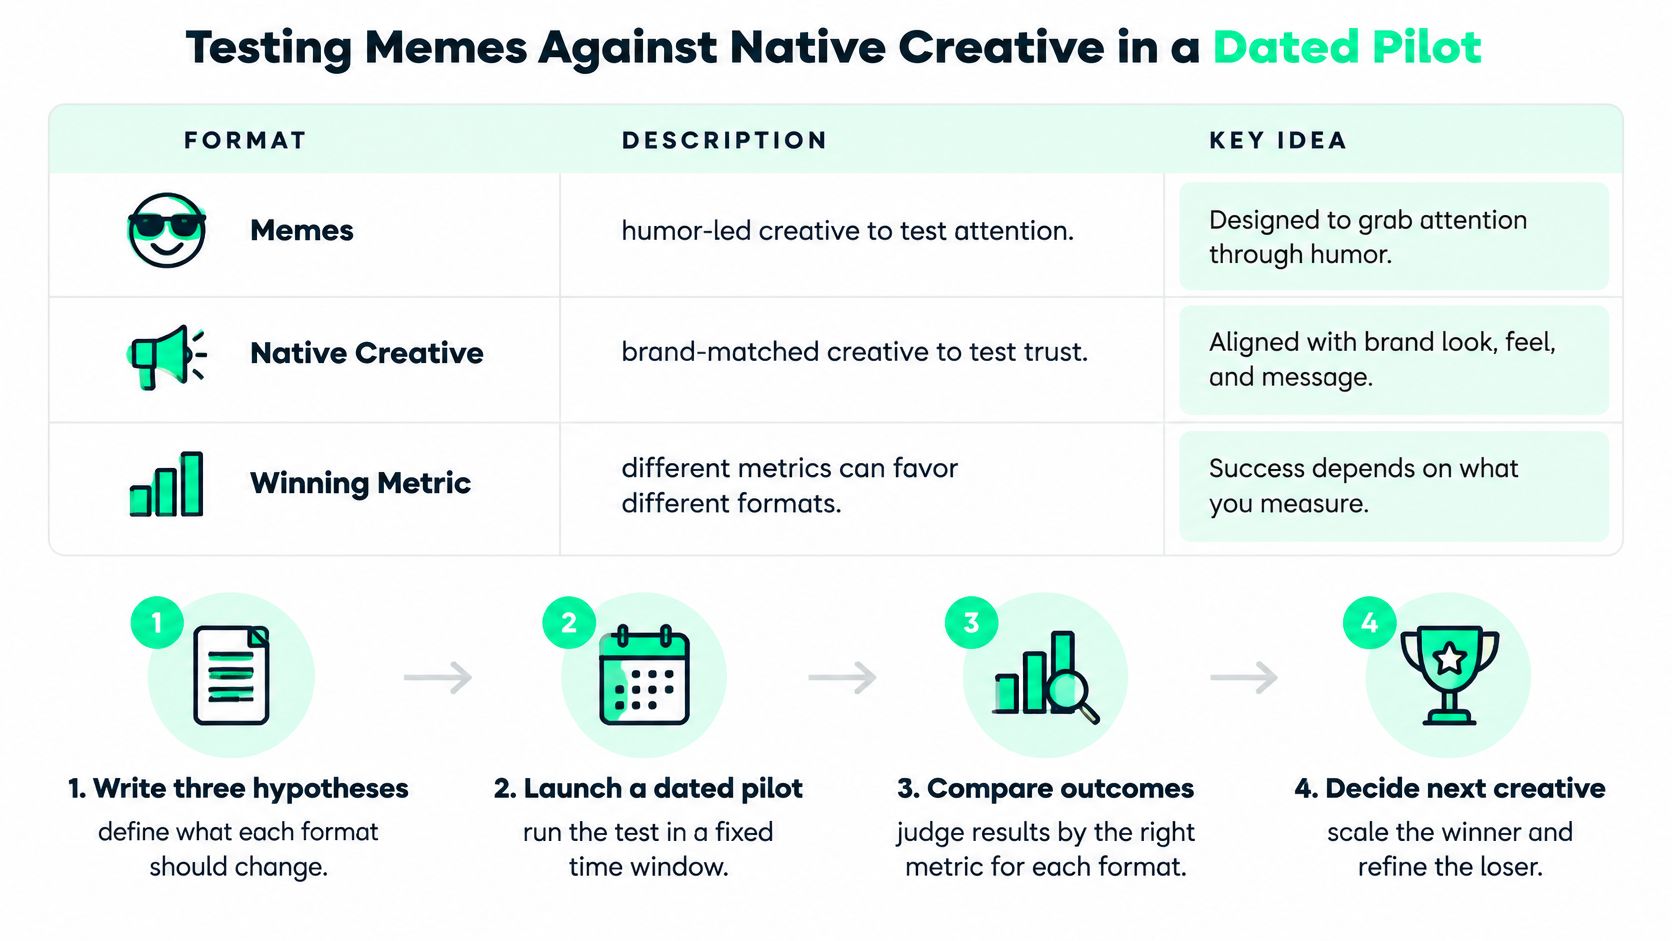
Memes and native creative don't fail or succeed on the same metric, which is why so many head-to-head tests end in an argument instead of a decision.
| Test metric | Memes | Native creative | What it proves |
|---|---|---|---|
| Thumb-stop rate in first seconds | Strong, fast hook | Moderate, depends on demo | Attention, not demand |
| Click quality | Often low-intent clicks | Fewer clicks, higher intent | Add-to-cart and checkout starts |
| Reposts and shares | High | Low to moderate | Organic reach and branded-search lift |
| Brand control over message | Lower, needs caption rules | Full | Rejection rate at review |
| Fatigue speed | Fast, often within weeks | Slower, often months | Frequency and completion trends |
Run the comparison in six steps
- Write three hypotheses that differ in kind. A problem-led native demo, an identity-led meme, a social-proof clip. Variants that differ only in the first three words teach you nothing you didn't already know.
- Hold audience, placement, offer, landing page and spend split constant so creative is the only variable in play. Every moving part you allow is a story you'll tell yourself later.
- Randomize delivery and instrument the funnel yourself with first-party or server-side tracking on add-to-cart and checkout. Platform pixels lose events, and lost events skew toward whichever variant loads slower.
- Read each asset at three levels. Delivery quality covers reach, frequency, completed views and invalid traffic. Behavioral response covers thumb-stop rate, landing-page engagement and add-to-cart. Only the third level decides anything: incremental contribution profit or iROAS.
- Keep a persistent test cell running rather than moving all spend onto the current leader. A network with one winner and no challenger is a network that's already fatiguing.
- Refresh on fatigue signals, not on a calendar. Rising frequency, falling completion rate and deteriorating conversion quality tell you the audience has seen it enough.
Don't declare a winner on CTR. A high-click meme can deliver a crowd of low-intent visitors, create attribution noise, and cannibalize the organic demand that made the placement look strong. Models that omit full business drivers produced incremental outcomes that were, on average, 47% inflated, according to Nielsen's analysis of ad measurement. Incomplete measurement doesn't just blur the answer. It flatters it.
Stratify results by creator handle, niche, geography and format before you declare anything. On a distributed network, an apparent creative win is often a page-quality or audience-composition effect wearing a costume. And fix your sample size and stopping rules in advance instead of refreshing the dashboard until a favorable fluctuation appears.
A dated pilot I'd run first: one product, one primary outcome, one meme format against one native format, one matched holdout geography, and a fixed 7 to 56 day read. Scale only the content that beats the holdout on incremental CPA.
If the holdout shows no lift, the creative or the page mix is wrong, not the channel. That distinction saves budgets. A structure like a 30 day meme marketing pilot makes the read date explicit so nobody renegotiates it mid-flight.
The commercial mechanics should be equally fixed before launch. Brands pay per view at a CPM set up front, and pending or rejected posts are never billed, so a creative that fails brand review costs time rather than budget. Brands apply through a form and don't need to book a call to get a pilot scoped.
Measuring Creator Distribution When Buyers Never Click
The last-click report is structurally unfair to creator distribution. A meme gets reposted, screenshotted, argued about in a group chat, and searched for days later, and none of that produces the referral path the attribution model wants to see.

The demand is real even when the click is missing. A 2025 survey reported by MediaPost on Gen Z discovery habits found that 41% of Gen Z respondents use social media first for information, and 90% said social content influenced a purchase in the previous six months. Buyers are being made somewhere other than the referral column.
Judge the channel on incremental contribution profit, not applause. Contribution profit means revenue after product cost, fulfillment, payment fees and media cost; if creator spend adds demand that would have arrived anyway, the lift is not incremental. Before spend scales, three gates should pass: exposed markets beat the matched holdout, US audience share stays inside the target range, and delivery stays clean enough that the placement would survive a brand review.
What to track instead of the last click
- Branded-search lift in exposed versus matched markets. Run weekly query volume against a geography where the campaign never ran. This is the cheapest honest read on discovery.
- Direct traffic and unique landing URLs per creator cluster. Use one URL per cluster, not per post, so you can attribute lift without pretending the buyer clicked once.
- A post-purchase question about first touch. Ask where the buyer first heard of the brand. Self-reported, imperfect, and still more accurate than a cookie that expired.
- A post-view window matched to the purchase cycle. A considered purchase with a two-week decision window judged on a one-day view window will always look like a failure.
- A geographic holdout first, media-mix modeling later. Add mix modeling when spend justifies the modeling cost, not before.
The trap cuts both ways. Optimizing only for the lowest CPM undervalues high-attention placements that carry the brand further than a cheap impression ever will. Optimizing only for engagement rewards content that entertains people without creating demand for the product. Both failure modes look like efficiency in a spreadsheet.
The decision rule is blunt. Keep a creator placement when branded-search or new-customer lift holds against the holdout, even if last-click attribution looks weak. Cut it when neither moves, and do not scale it until US share and delivery quality pass with it. Attention that never converts into demand is entertainment you paid for.
Brand Controls for Programmatic Creator Campaigns
Brand safety gets discussed as a content problem when it's also a delivery-quality problem, and both are measurable. Integral Ad Science's 20th Media Quality Report found the share of offensive content rose 72% year over year, fraud rates for campaigns without fraud protection rose 19%, and global desktop-video viewability reached 83.9%, a record high in its dataset.
| Control | Risk it addresses | Before launch | After launch |
|---|---|---|---|
| Creator disclosure | Undisclosed paid endorsement | Disclosure in caption checked before posting | Spot-check live posts weekly |
| Banned claims and required terms | Off-brand or regulated claims | Brief rules and keyword checks | Review flagged posts and reject |
| Geo and follower filters | Non-US or low-quality audiences | US geo filter and minimum follower threshold | Verify US share of views |
| Offensive context | Brand next to unsafe content | Human review of captions and clips | Monitor comments and context drift |
| Invalid traffic and viewability | Fake or unseen views | Fraud screening and viewability threshold | Compare verified and reported views |
Three checks, not one
Content suitability, invalid-traffic protection and viewability are separate questions, and a view count answers none of them. A placement can be brand-safe, fully viewable and still delivered to an audience you'd never pay to reach. That's why audience geography belongs in the same review as the caption.
The workflow that holds up runs in a fixed order. Approved captions and disclosure language get locked before a clip is trafficked. Each submission is scored automatically for speed, then read by a person before it posts. Campaigns get monitored daily during launch and weekly once delivery stabilizes. A page that drifts comes out of the network entirely rather than being excluded from one campaign, because a page that broke a rule once will break it for the next advertiser too.
Disclosure isn't optional housekeeping. The FTC's influencer disclosure guidance defines a material connection to include payment and free or discounted products, and says the relationship must be made obvious when an endorsement could affect U.S. consumers. Every brief tells creators to disclose paid promotion, such as with #ad, under FTC guidelines, and creators are contractually responsible for it.
The owner question: name the person with authority to pull a live post, and the number of minutes they have to act. A policy without a named owner and a response window is a paragraph, not a control.
Any network worth vetting will show its work: automated scoring on every submission in real time, a named human reviewing flagged posts, geo filters that restrict delivery to tier-1 markets, and proof that reported views come from American audiences in high-quality geographies rather than undifferentiated global impressions. Ask for the review logs, not the media kit. The full sequence is worth documenting in your own brand approval process so nobody renegotiates it under deadline.
Scaling Creator Placements Without Wasting Spend
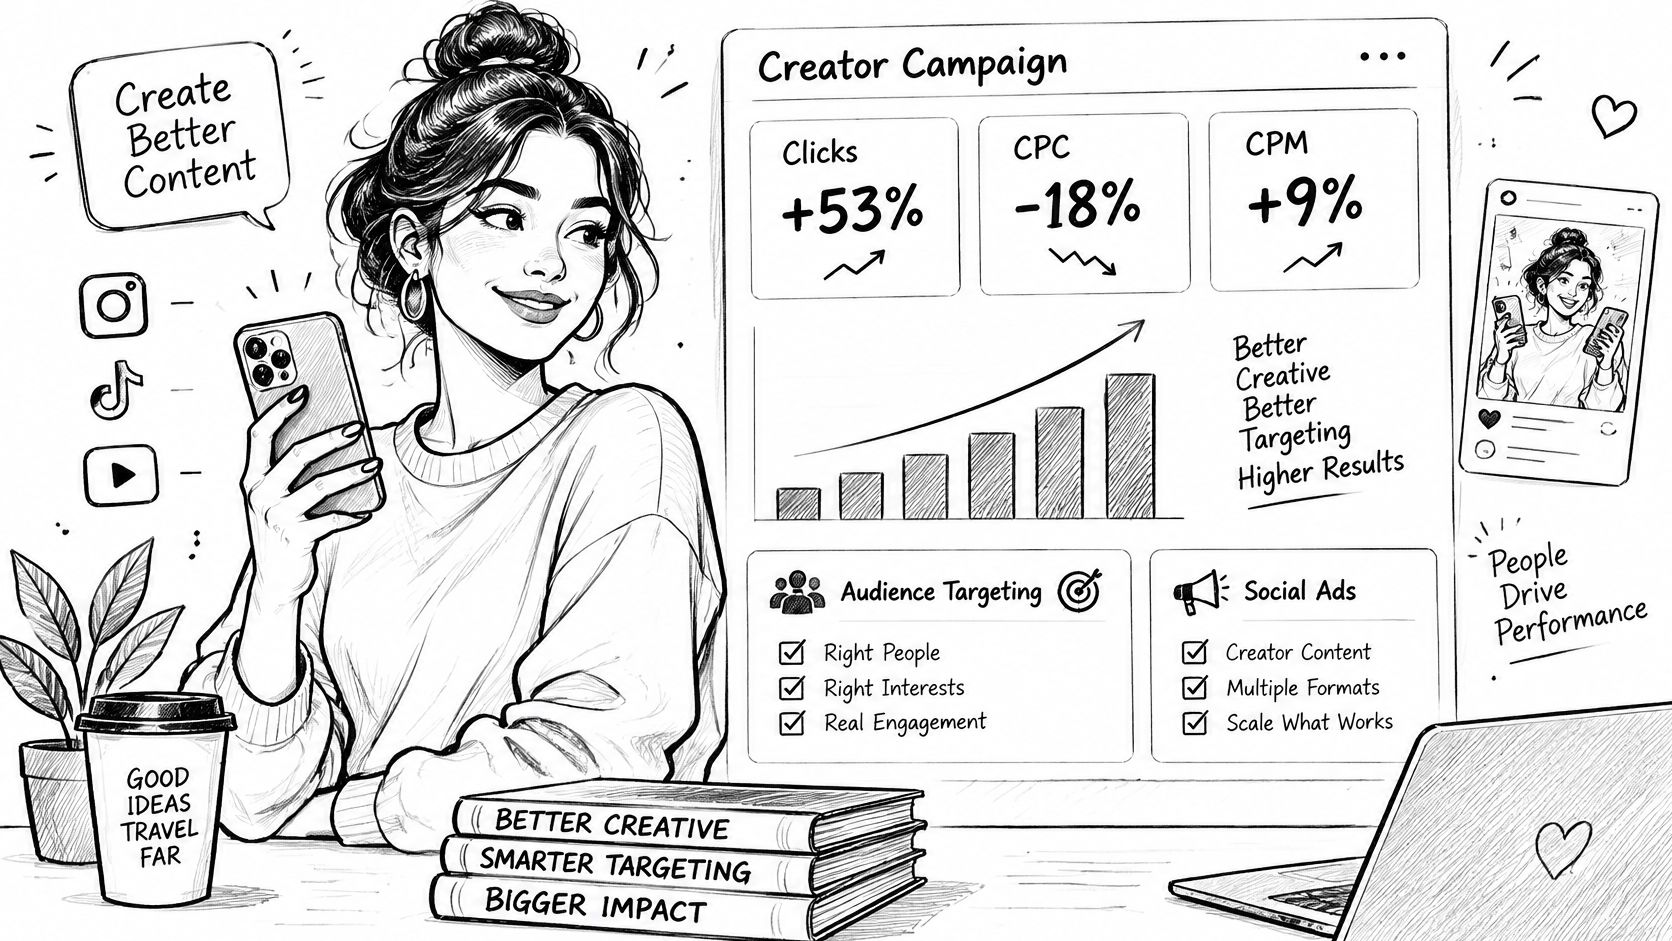
Cheaper media isn't automatically better media. Skai's Q2 2026 quarterly digital trends report recorded paid-social clicks up 53% and CPC down 18%, while CPM still rose 9%. The efficiency came from creative and targeting, not from inventory getting cheaper. Creator budgets are growing on the same pattern, with spend scaling faster than the proof of what it returns. That is why the ceiling on any placement should come from incremental contribution profit, not from the ROAS a platform reports.
Three questions, asked in this order
Which content deserves amplification? Judge candidates on cost per qualified visit, incremental conversion, new-customer rate, creative fatigue and post-view lift. CPM and CTR describe the auction. They do not describe the outcome.
At what frequency? A placement that works at three exposures per user can destroy its own result at twelve. Cap frequency per audience and treat a falling completion rate as the early warning, because it shows up before the CPA does.
Against which audience or buying objective? The same clip can be a discovery asset for a cold audience and a waste of money against people already in the funnel. Scaling a winner into the wrong objective is still wasting spend, just at a higher number.
Five scaling rules that survive contact with a budget
- Start with formats that already earn organic shares. Distribution amplifies what people were going to pass along anyway.
- Cap frequency and watch completion. Rising frequency with falling completion means you're paying to annoy the same people.
- Verify the American share of views against a national base. Pew Research Center's 2025 survey of 5,022 U.S. adults found 84% had used YouTube, 71% Facebook, 50% Instagram and 37% TikTok (Pew Research Center). A network claiming reach well beyond those levels in tier-1 markets deserves a harder look before the first invoice.
- Test broad, culturally native placements when targeting signals are weak, then tighten once you know which niche converts. Broad doesn't mean uncontrolled: brand-safety, fraud, disclosure and audience-quality checks apply either way.
- Scale only after a holdout confirms lift. Withhold a share of pages or a matched slice of markets, and raise spend only when the incremental CPA clears the ceiling you set from margin.
Creator supply keeps growing, and so does the noise on the buying side. If you want to read the deal from the supply side before you buy it, apply to become a creator and look at what a properly written brief asks of the people posting for a brand.
The operating principle underneath all of it is unglamorous. Tier-1 US audience share and brand safety are gates, not scores. A placement that fails either one doesn't get scaled at a discount. It comes out of rotation, and the budget moves to the next candidate in the queue. I would rather pause a week of delivery than fund another month of reach that only looks good inside a platform dashboard.
FindClout distributes approved brand content programmatically across a curated network of tier-1 US creator pages and sells verified views on a CPM agreed up front: product placement caps at $0.20 CPM across the network, or $0.25 CPM scoped to a single vertical such as sports or finance. Each campaign brief can fix required captions, keywords and banned claims, posts that break them are rejected and never billed, and only approved posts count toward spend. Brands apply through the form at FindClout, with pilots running $20K–$30K against a guaranteed 100M verified views, so the holdout decides whether the next dollar goes in.
Want this audience for your brand?
FindClout puts your brand in front of verified American audiences across every major US page — brand-safe, at scale.
Start Your Campaign