 findclout.com
Ad Fraud Explained: Types, Costs and How to Stop It
A counted view is not a person in a seat. In 2023, about 22% of worldwide online advertising expenditure, roughly $84.2 billion, was lost to fraudulent activity, based on about 78,000 data points across 45 countries, according to Juniper Research. The same estimate put the damage at about 30% of mobile advertising spend, 20% of online display, 20% of online search, 17% of in-app advertising, and 15% of online video, and projected losses near $172.3 billion by 2028 if prevention lags spend.
That bill is why a headline fraud rate is a bad way to pick a deal. Two percentages can both be real and still describe different units, different inventories, and different moments in the filter. The number a buyer can defend is the price of a verified view in a tier-1 American audience, next to content that passed a brand rule before it went live.
Table of Contents
- What Ad Fraud Is and the Forms It Takes
- How Much Ad Fraud Costs by Channel
- How to Compare Reported Fraud Rates
- How Ad Fraud Inflates CPMs and Cuts ROI
- Detection Methods That Catch Fraud Before Billing
- Audience Vetting Signals and Human Review
- Mitigation Steps and a Pre-Campaign Audit
What Ad Fraud Is and the Forms It Takes
Think of a stadium that sells every seat and then fills some of them with cardboard cutouts. The turnstile count looks full. The gate is still fake. Ad fraud is any manipulation of ad delivery, measurement, or engagement that bills an advertiser for activity no real person saw.
Not all of that waste looks the same in a log. General invalid traffic is the obvious layer: known bots, data-center crawlers, and other automation a basic filter can name. Advanced invalid traffic is the harder layer: human-like bots and click farms that pass those filters because the device, the IP, or the click timing looks ordinary one event at a time.
Say a sports-betting brand buys a burst of creator posts aimed at U.S. fans. The dashboard shows the view goal. A closer read shows half the "viewers" never stay long enough to see a logo, and a cluster of reposts lands from accounts with no history. The campaign was delivered. The attention was not.
| Fraud type | How it works | Where it appears | Warning sign |
|---|---|---|---|
| Bot traffic | Scripts load pages and fire impressions with no human viewer | Display, video, in-app | View durations near zero |
| Domain spoofing | Inventory is labeled as a premium site but served from a cheaper domain | Programmatic display | Seller missing from the supply list |
| Ad stacking | Several ads are layered in one slot and only the top one is seen | Display | Many impressions with identical timestamps |
| Pixel stuffing | Ads are placed in hidden 1x1 frames and still counted as viewed | Display | Near-perfect viewability with almost no clicks |
| Click injection | Fake clicks are attributed to app installs just before they happen | Mobile app | Clicks arriving milliseconds before installs |
| Fake creator engagement | Purchased followers, comments and reposts come from coordinated accounts | Social and creator pages | Audience location mismatch and repeated identical reposts |
| AI-generated impersonation | Synthetic creators or cloned brand identities post content | Social and creator pages | Accounts with no posting history |
Read the table from the warning-sign column backward. Most fraud hides behind a healthy-looking metric, so check where that metric came from before you trust the number. A perfect viewability score can mean a hidden frame. A sudden follower spike can mean a farm. A clean country label can still be a spoofed device.
Practical rule: If the report cannot name the page, the seller, and the view duration, treat the count as unproven.
How Much Ad Fraud Costs by Channel
The dollar total can climb even when the percentage stays flat, because media budgets grow. A stable share of a larger pie is a larger loss. Browser inventory and in-app inventory both leak, through automated traffic, fake engagement, attribution tricks, click inflation, and bots that distort what a campaign report calls success.
One network-wide fraud rate is a poor control. Environments do not fail at the same rate, and a premium market does not make the traffic human.
A Q2 2025 benchmark of more than 120 billion programmatic impressions, reported via Pixalate's release on Yahoo Finance, split invalid traffic like this.
| Environment | US invalid traffic rate | Global invalid traffic rate | What it means for buyers |
|---|---|---|---|
| Desktop and mobile web | 21% | 19% | Verify placement and referrer data on every page |
| Mobile apps | 24% | 29% | Require device and SDK validation before billing |
| Connected TV | 18% | 18% | Check household and session signals, not only country |
U.S. mobile apps ran hotter than U.S. web in that cut (24% versus 21%). Global app inventory ran hotter still, at 29%. Connected TV matched at 18% in both cuts, which is still nearly one impression in five. A U.S. geotarget does not settle authenticity. Premium-market traffic can carry a large invalid share.
A number you can run on your own budget
Multiply the budget by the invalid-traffic rate for that environment. That product is spend at risk, not a refund you are owed.
$100,000 in U.S. mobile apps at 24% puts about $24,000 in question. The same budget on U.S. connected TV, using 18%, puts about $18,000 in question. Split the buy by placement, device, geography, and traffic source, or the blended rate will hide the expensive slice.
For a U.S. brand, the useful cut is American pages with a plausible session, not a single network average. Hold raw timestamps, referrer or source fields, view duration, repeat-device flags, and delivery logs. When a page breaks the invalid-traffic line you agreed, suppress it or take a make-good. Country of origin is a filter. It is not proof someone watched.
How to Compare Reported Fraud Rates
Two fraud rates are often incomparable before anyone argues about who is honest. The gap usually comes from three choices.
Unit. A rate may count impressions, clicks, spend, installs, or leads. Twenty percent of clicks is not twenty percent of impressions, and neither is twenty percent of dollars.
Scope. Open-auction inventory and a vendor's own client accounts are different pools. A clean client book can sit next to a dirty open exchange and both reports can be accurate.
Filtering stage. A rate taken before platform filtering is usually higher than a rate taken after known bots are already removed. You are not looking at the same pile of events.
A 2026 dataset covered by YouTarget shows how wide that gap gets. After more than 80 billion programmatic impressions, invalid traffic was 20% on web, 41% on mobile apps, and 26% on connected TV. Another large-advertiser benchmark in the same discussion reported only 0.1% of spend. Those figures are not a contradiction until you pretend they measure the same thing.
Five questions before you rank a vendor
- Which unit is the rate built on? Impressions, clicks, spend, installs, or leads.
- Whose inventory is in the denominator? Open auction, or the vendor's own clients.
- When was it measured? Before filtering, or after.
- What is the split? Web, app, and connected TV, not one blended percent.
- What does the report show in money? Dollars lost, or only a percentage.
Then put both deals on cost per verified view. Take the spend that survives the comparable invalid share and divide by views that still look like human exposure in the geography you bought. A cheap CPM with an unfiltered app rate can cost more per real view than a higher CPM that already excluded invalid traffic.
A single headline rate does not transfer across environments. Mobile-app traffic and connected TV do not carry the same risk as web, so a web percentage pasted onto an app plan will misprice the buy.
How Ad Fraud Inflates CPMs and Cuts ROI
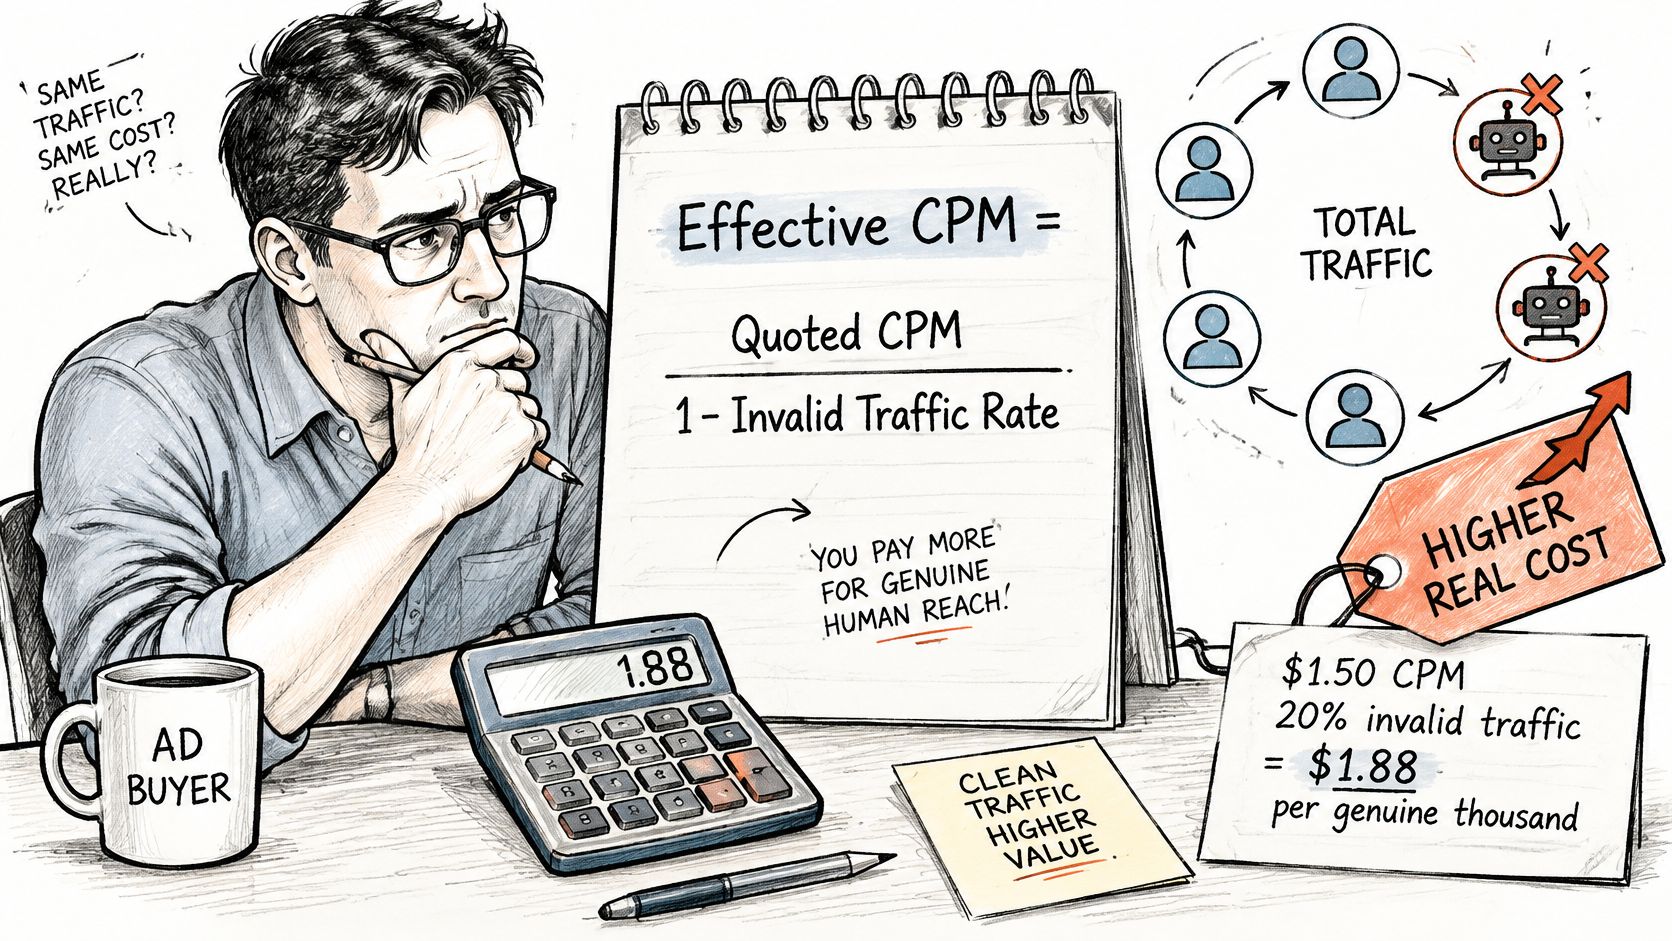
Effective CPM equals the quoted CPM divided by (1 minus the invalid-traffic rate). The invoice does not change. The price of a genuine thousand impressions does.
A $1.50 CPM with 20% invalid traffic costs $1.88 per genuine thousand. That is a 25% rise: you divide by 0.80, and 1 divided by 0.80 is 1.25. The dashboard still shows $1.50.
| Quoted CPM | 10% invalid traffic | 20% invalid traffic | 30% invalid traffic |
|---|---|---|---|
| $0.20 | $0.22 | $0.25 | $0.29 |
| $1.50 | $1.67 | $1.88 | $2.14 |
| $3.00 | $3.33 | $3.75 | $4.29 |
Waste is wider than bots. The Association of National Advertisers programmatic study, announced in June 2023, looked at an open-web ecosystem of about $88 billion and found as much as $20 billion, around 23%, wasted. The underlying cut was $123 million in spend from September 2022 to January 2023 and 35.5 billion impressions. That 23% includes invalid traffic, extra intermediaries, poor inventory, and spend that never created real exposure. It is not a pure bot rate. A campaign can lose value even when every impression was purchased and counted.
What that does to ROI
Put $10,000 behind a placement with 20% invalid traffic and you bought about $8,000 of real exposure. Conversions and cost per acquisition move against you while the impression chart still looks healthy. If you judge the channel on a blended return, read Alpha Omega Digital's ROAS guide beside this adjustment, or a strong return can be an average of real buyers and empty events.
Compare cost per verified view, not cost per impression. The same logic sits inside any CPM advertising plan: the quoted price is only the start of the arithmetic.
Detection Methods That Catch Fraud Before Billing
Catching fraud after the invoice is documentation. Catching it before billing is cost control. A workable stack uses four layers, in order, and each layer has a blind spot.
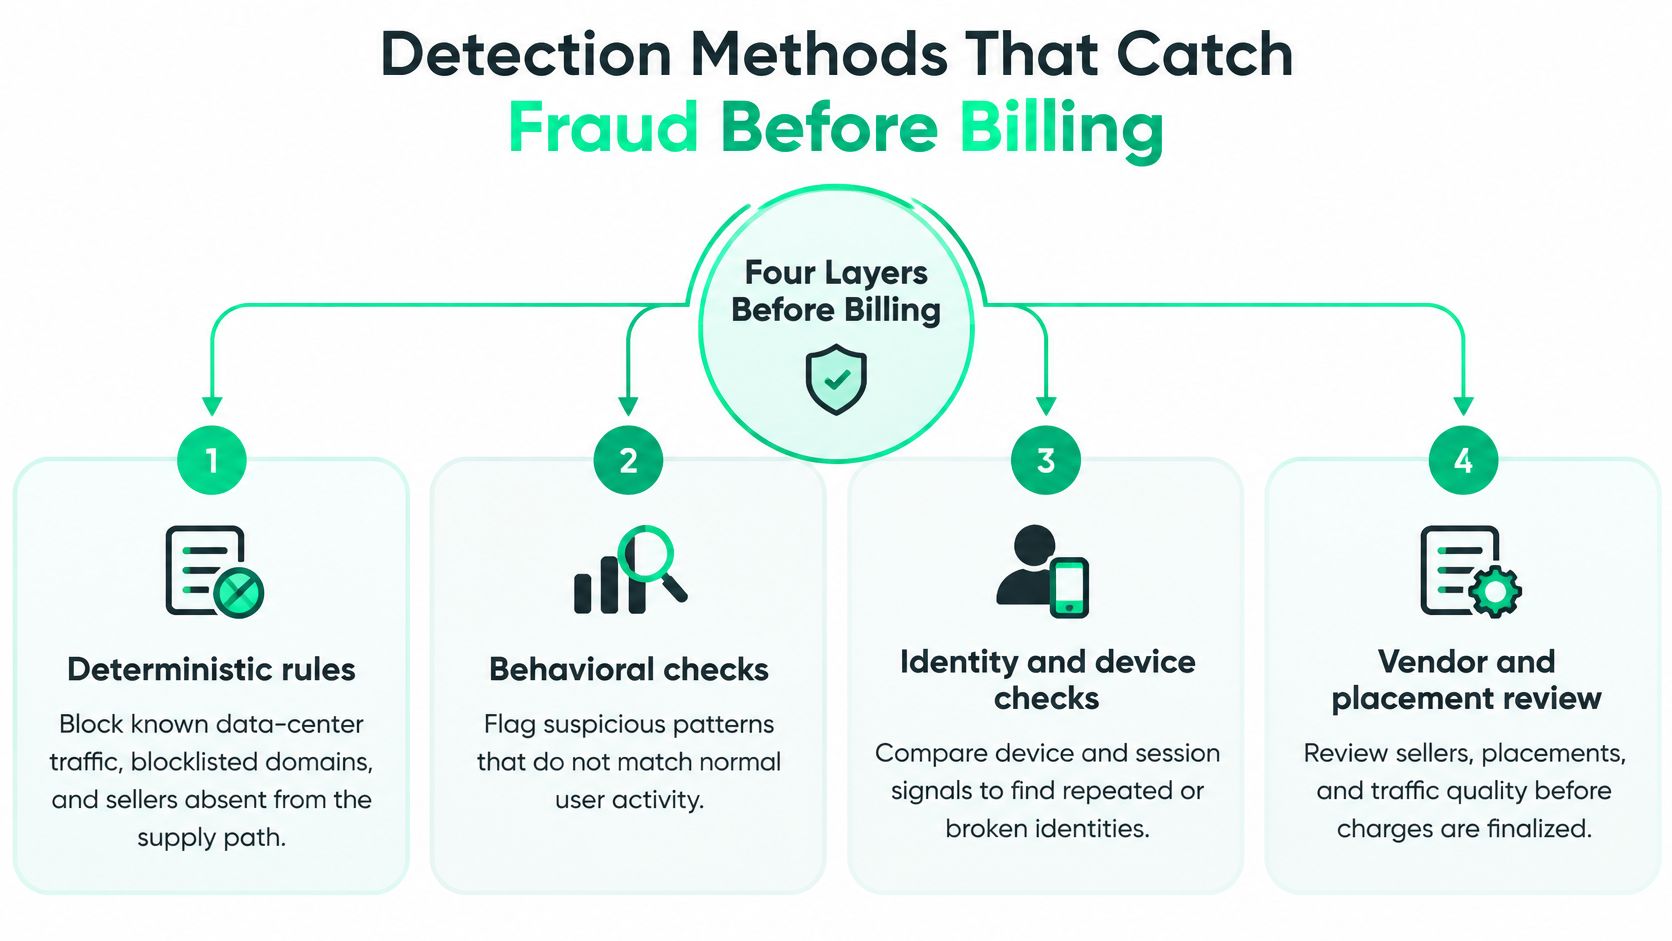
Layer one, deterministic rules
Block known data-center traffic, blocklisted domains, and sellers that are absent from the supply path. This layer is fast and explainable. It misses anything that is not already on a list, including a new domain spoof or a phone that is real.
Layer two, statistical anomalies
The Nameles research system, described in an ACM paper on bid-request filtering, analyzed about 1.8 billion daily bid requests and classed about 20% of traffic as invalid on average. It used Shannon entropy on domain-level request patterns. Fraud often piles up as repetitive combinations of domains, devices, placements, and timestamps. Legitimate traffic is more mixed. Entropy alone fails when a click farm uses many real smartphones. Each event looks valid. The coordination is the fraud.
Layer three, a score before the post
Score the single event fast enough to hold it before it is posted or billed. On creator distribution, unverified, unscraped, or suspicious posts are quarantined and accrue nothing unless and until they are approved. A score is not a verdict. It is a gate.
Layer four, cohorts
The same ACM work points to device classification, clustering on app-usage patterns, and relabeling the whole cluster. Flag synchronized bursts, implausibly high repeat exposure, identical timing, broken engagement funnels, and shared device or behavior fingerprints. One odd viewer is noise. Fifty accounts moving together are a pattern.
Decide before billing when you can. Reconcile delayed signals after the flight, and keep the exclusion rules visible so a maker-good has a paper trail. Creator checks belong in that same path. If you are comparing audience-audit tools, explore HypeAuditor competitors for creator discovery and then test whether the tool can show repeat-device clusters, not only a follower count. For the event logic itself, our notes on fraud traffic detection walk through what a held post looks like before anyone is paid.
Audience Vetting Signals and Human Review
A single bot score is the wrong instrument once creative, identity, and engagement can all be faked. Reporting on an ADEX analysis of 1.2 million campaigns and 4.9 million creatives, covered by Mallory, said AI-generated or AI-assisted assets appeared in 52% of detected fraud schemes, including human-impersonating bots, brand cloning, fake endorsements, and deepfakes. A 2026 DoubleVerify finding in that same reporting said AI bots generated 15% of clicks in unprotected campaigns and, in some studies, produced ten times more clicks than humans.
Not every bot is an attack. Some crawlers are useful, and they can still warp a performance chart. The question is whether the activity is plausible human exposure with commercial value, especially in a U.S. audience whose language, hours, and devices match the page.
| Signal | Plausible human pattern | Fraud pattern |
|---|---|---|
| Audience geography | Viewers match the creator's language and local time zones | Views concentrated in one country with no matching language or time pattern |
| Device mix | Varied device models and operating system versions | A few device types repeated across many accounts |
| Posting velocity | Steady posting that follows a natural schedule | Sudden spikes of identical reposts |
| Creative provenance | Original, licensed or credited source material | Recycled frames, cloned brand assets or synthetic faces |
| Engagement network | Comments differ in wording and timing | Identical comments from related accounts within minutes |
| Click-to-session | Clicks lead to sessions with scrolling and real time on page | Clicks with zero session time or immediate bounces |
A target country does not prove a person. U.S. traffic with no English, no U.S. time-of-day shape, and one repeated handset is a mismatch, not a win. The same test applies to synthetic memes, cloned creator identities, and coordinated reposts that inflate "verified attention" without a session on the other side.
Who decides, and how you appeal
A reviewer takes the cases the scores flag and chooses removal, payment withholding, or another pass, and writes down why. Fraud, bot, view-authenticity, and earnings-eligibility calls are final inside the internal review, but a human review of an automated decision, such as withheld earnings from a fraud score, can be requested by contacting FindClout. Score the whole chain: publisher identity, geography, velocity, creative origin, engagement, repeat viewers, click-to-session continuity, and conversion quality. Demographic filtering is one cut in that chain, not a substitute for it.
If the only evidence is a country code, you do not yet have an audience.
Mitigation Steps and a Pre-Campaign Audit
Brand safety and brand suitability are different jobs. Safety keeps an ad off clear reputational harm. Suitability is what this brand will accept. IAB reporting on publishers using these tools found that more than 80% were setting custom inclusion and exclusion criteria at the content or episode-title level, often with the IAB Content Taxonomy and GARM frameworks. That is the model for a U.S. creator network: every submission reviewed against the brief, in real time, so scale does not mean a looser rule.
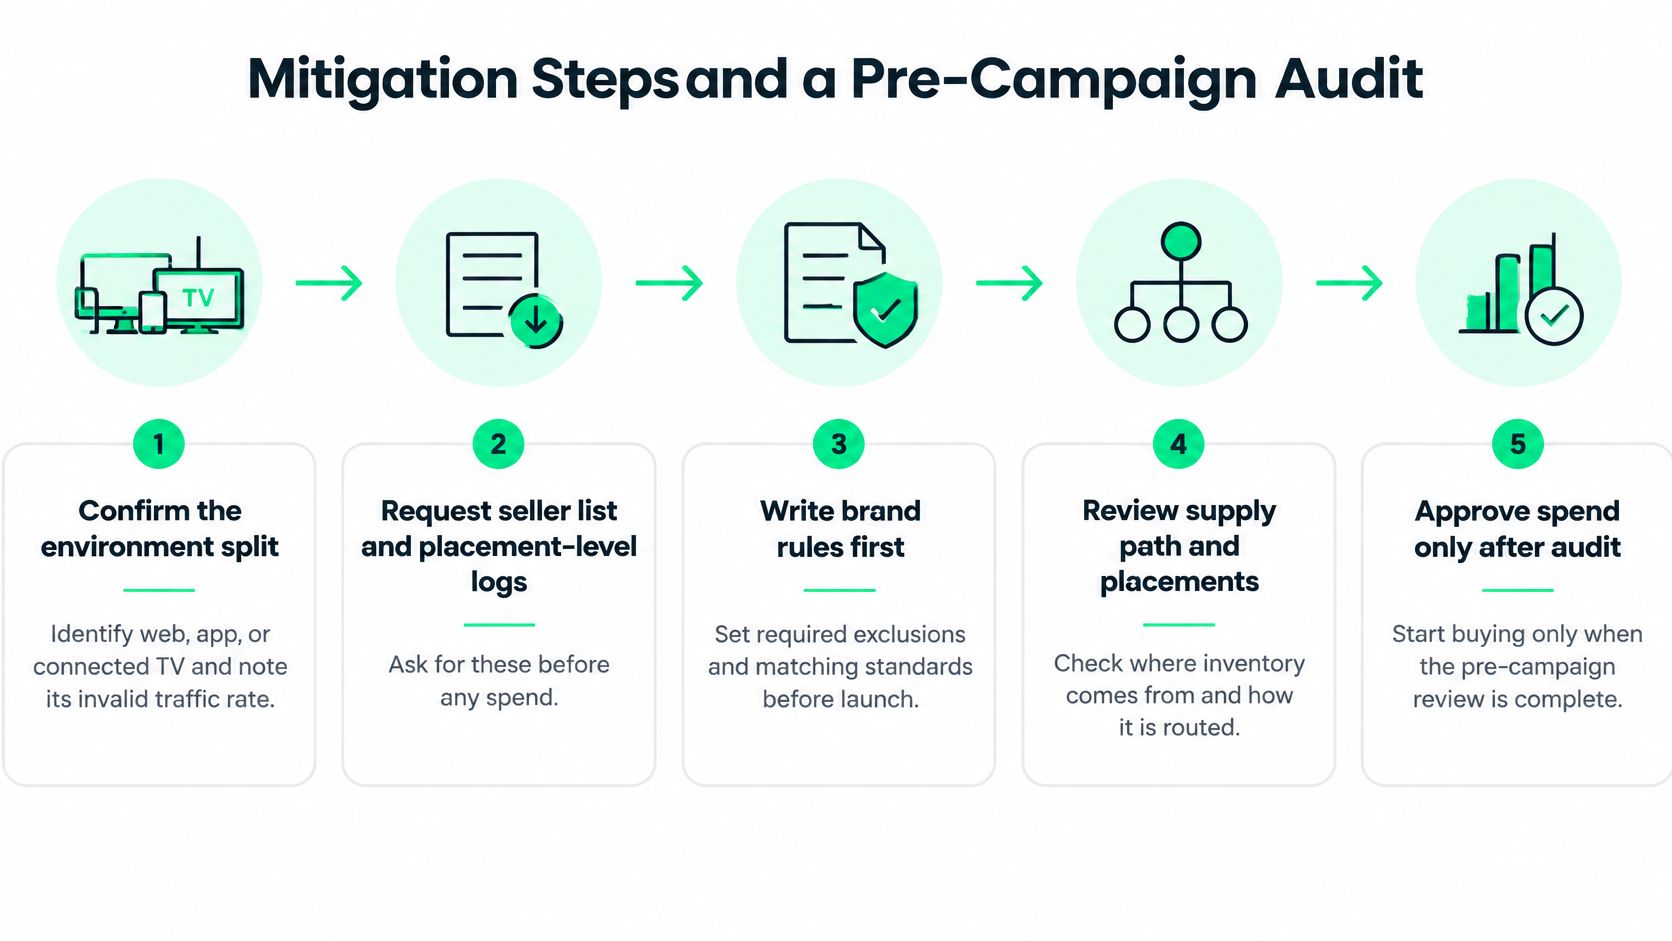
Confirm the environment, then ask for the paper. Name web, app, or connected TV and the invalid-traffic rate you will use. Request the seller list and placement-level logs before any spend. The common slip is signing a CPM and hoping the log shows up later.
Write brand rules before creative. Required terms, prohibited topics, vertical exclusions, minimum follower thresholds, and U.S.-first geo filters for tier-1 audiences. Set suitability at the content and title level, not with one generic blocklist. Content is checked before payment, and a brief can rule out whole topics. The slip is a blocklist that never mentions the niche you fear.
Pre-approve, then score, then post. Captions, logos, and targeting need sign-off. Score every placement before it goes live. Pending or rejected posts are never billed, and only approved posts count toward a brand's spend. The common slip is billing a post that is still pending.
Watch the live cut by page. Nielsen describes audience measurement as real-time insight into who is watching, listening, and engaging, not only how many ads were served. Break delivery down by handle and remove an off-brand or weak page in one click. The slip is waiting for the end-of-flight deck.
Set a threshold that forces an action. Example: if invalid traffic exceeds 10% of a page's views, suppress that page or issue a make-good. A threshold nobody enforces is a slogan.
Reconcile with the raw fields. Timestamps, source metadata, view duration, and delivery logs, after the flight. Separate general invalid traffic, advanced invalid traffic, accidental automation, and legitimate crawlers so you are not arguing about one blended percent.
Audit the money, not only the views. Rates, budgets, and caps are audited internally and every money change is logged, so a charge traces to a decision. The slip is a spreadsheet edit with no author.
Ask for the sample before you commit. Before budget moves, ask a U.S.-focused creator network for a sample reconciliation and for how a withheld payment reaches a person. We will walk through that packet, including an appeal to human review. For American sports, gaming, and betting brands, the extra check is league-level inclusion, not "sports" as one bucket. Nielsen's U.S. Sports Fan Insights work covers eight leagues (NFL, NBA, MLB, NHL, MLS, WNBA, NASCAR, and PGA Tour) with 17,750 respondents, which is a reminder that fan pools are not interchangeable.
North America is not automatically clean. Integral Ad Science's 2025 regional benchmarks put North America at a 1.4% invalid-traffic rate and a 1.5% made-for-advertising rate, with a 70.3% brand-suitability rate, so roughly three in ten measured impressions missed that suitability standard. Reach without a review is how those impressions get into a U.S. plan.
A view total in the billions is only useful if each submission was checked, the geography is the one you bought, and a rejected post never hit the invoice.
FindClout distributes branded creator posts across vetted pages built for tier-1 American audiences, with real-time review so brand rules and fraud checks happen before a view is billed. If you want high-quality U.S. attention, including sports fans, without paying a cardboard crowd, start with a sample reconciliation on FindClout.
Want this audience for your brand?
FindClout puts your brand in front of verified American audiences across every major US page — brand-safe, at scale.
Start Your Campaign